For items 10-15: A study was conducted to investigate the interactions between California sheephead, macroalgae, and urchins. The output path diagram of the study is given below: kelp stipe density O A. direct sheephead biomass OB. indirect O C. spurious O D. unanalyzed urchin density crustose coralline algae For items 11-15: Identify the type of effect component that exists between each pair of variables: 12. urchin density to kelp stipe density fleshy algal cover
For items 10-15: A study was conducted to investigate the interactions between California sheephead, macroalgae, and urchins. The output path diagram of the study is given below: kelp stipe density O A. direct sheephead biomass OB. indirect O C. spurious O D. unanalyzed urchin density crustose coralline algae For items 11-15: Identify the type of effect component that exists between each pair of variables: 12. urchin density to kelp stipe density fleshy algal cover

MATLAB: An Introduction with Applications
6th Edition
ISBN:9781119256830
Author:Amos Gilat
Publisher:Amos Gilat
Chapter1: Starting With Matlab
Section: Chapter Questions
Problem 1P

Related questions
Question
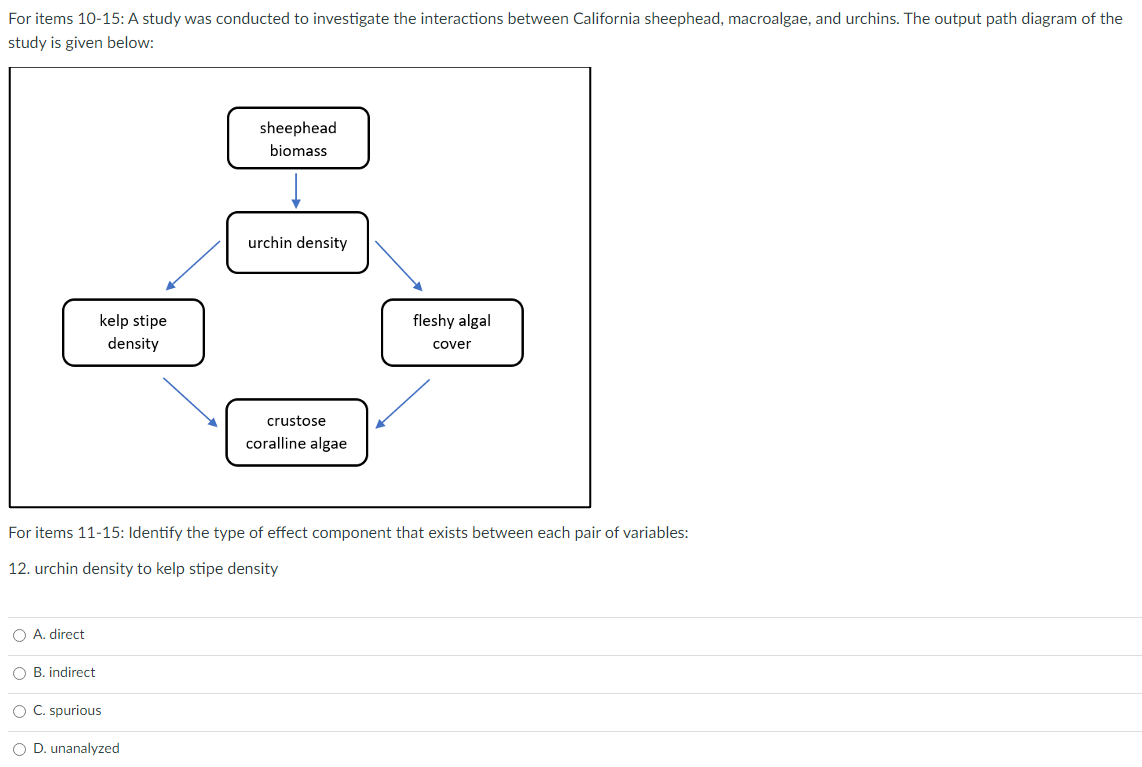
Transcribed Image Text:For items 10-15: A study was conducted to investigate the interactions between California sheephead, macroalgae, and urchins. The output path diagram of the
study is given below:
O A. direct
kelp stipe
density
O B. indirect
O C. spurious
sheephead
biomass
O D. unanalyzed
urchin density
For items 11-15: Identify the type of effect component that exists between each pair of variables:
12. urchin density to kelp stipe density
crustose
coralline algae
fleshy algal
cover
Expert Solution
This question has been solved!
Explore an expertly crafted, step-by-step solution for a thorough understanding of key concepts.

Step by step
Solved in 2 steps with 1 images

Recommended textbooks for you
MATLAB: An Introduction with Applications
Statistics
ISBN:
9781119256830
Author:
Amos Gilat
Publisher:
John Wiley & Sons Inc

Probability and Statistics for Engineering and th…
Statistics
ISBN:
9781305251809
Author:
Jay L. Devore
Publisher:
Cengage Learning

Statistics for The Behavioral Sciences (MindTap C…
Statistics
ISBN:
9781305504912
Author:
Frederick J Gravetter, Larry B. Wallnau
Publisher:
Cengage Learning
MATLAB: An Introduction with Applications
Statistics
ISBN:
9781119256830
Author:
Amos Gilat
Publisher:
John Wiley & Sons Inc
Probability and Statistics for Engineering and th…
Statistics
ISBN:
9781305251809
Author:
Jay L. Devore
Publisher:
Cengage Learning
Statistics for The Behavioral Sciences (MindTap C…
Statistics
ISBN:
9781305504912
Author:
Frederick J Gravetter, Larry B. Wallnau
Publisher:
Cengage Learning

Elementary Statistics: Picturing the World (7th E…
Statistics
ISBN:
9780134683416
Author:
Ron Larson, Betsy Farber
Publisher:
PEARSON

The Basic Practice of Statistics
Statistics
ISBN:
9781319042578
Author:
David S. Moore, William I. Notz, Michael A. Fligner
Publisher:
W. H. Freeman

Introduction to the Practice of Statistics
Statistics
ISBN:
9781319013387
Author:
David S. Moore, George P. McCabe, Bruce A. Craig
Publisher:
W. H. Freeman