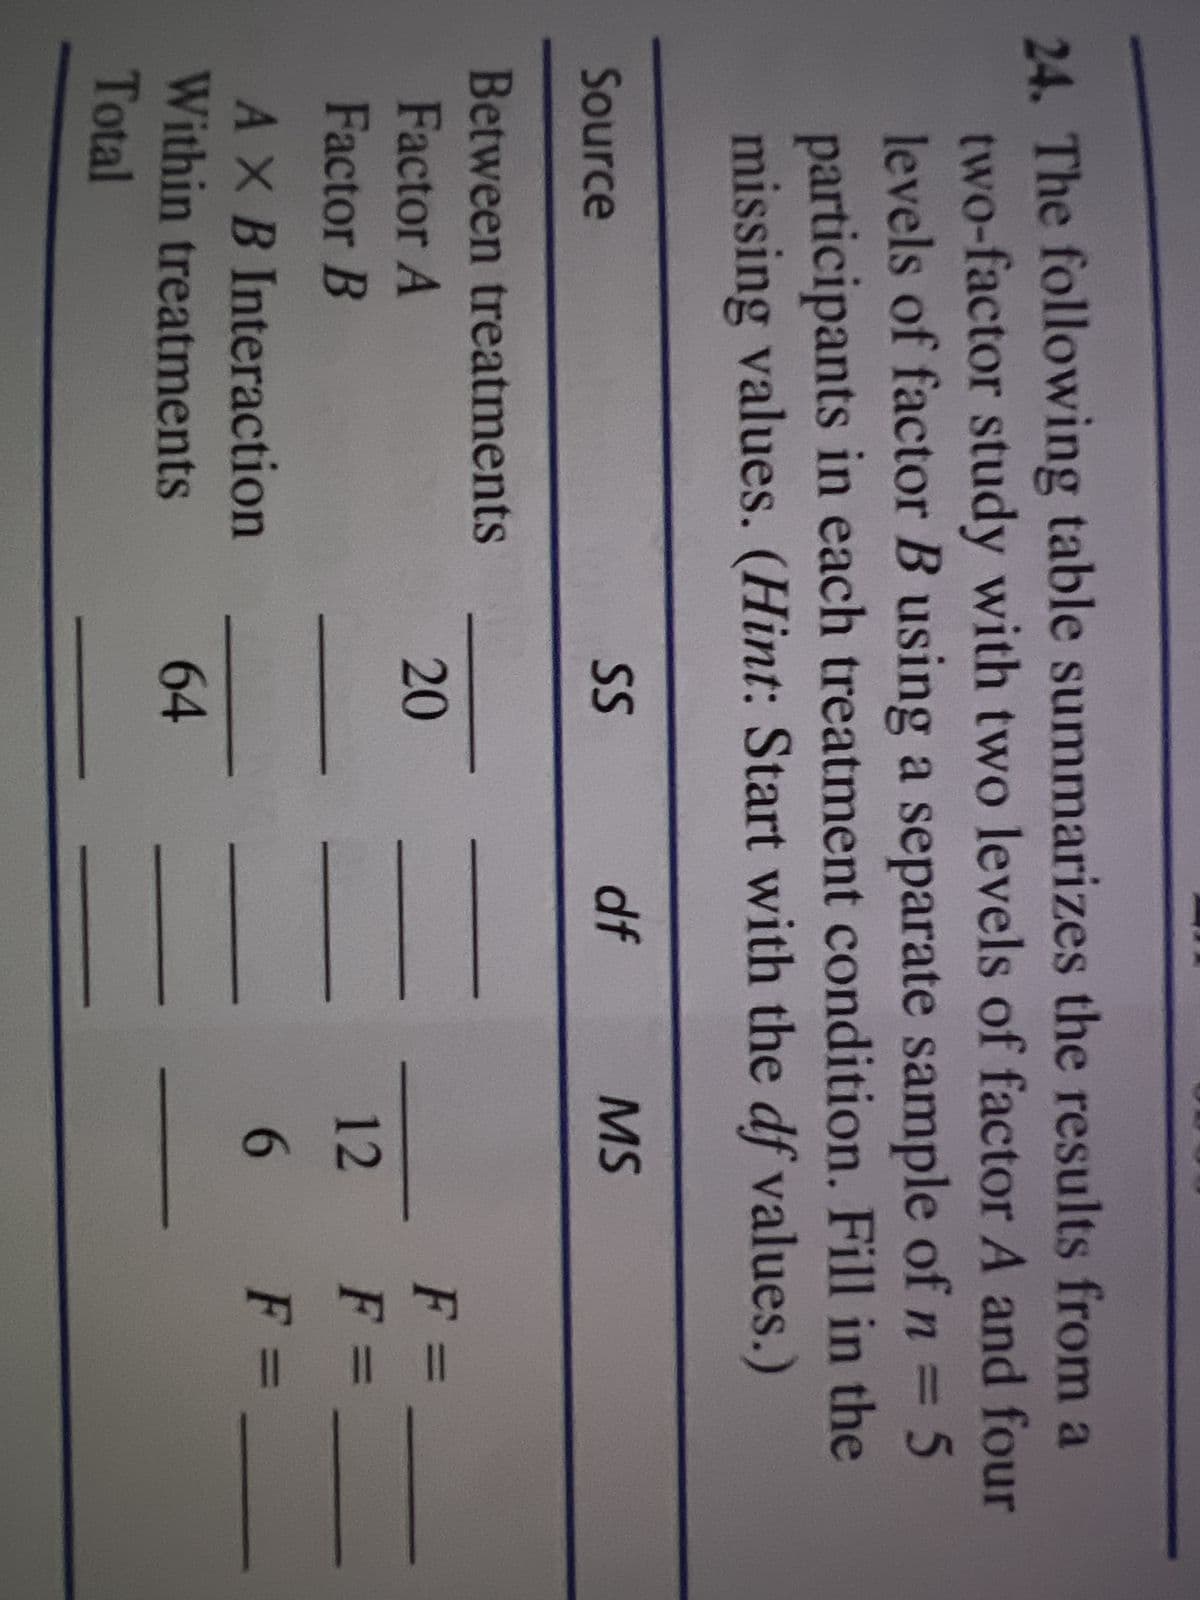
24. The following table summarizes the results from a two-factor study with two levels of factor A and four levels of factor B using a separate sample of n = 5 participants in each treatment condition. Fill in the missing values. (Hint: Start with the df values.) Source Between treatments Factor A Factor B A X B Interaction Within treatments Total SS 20 64 df MS 12 6 F = F F =
Q: Twenty years ago, a very famous psychologist specializing in marriage counseling authored a book…
A: Note- Since you have posted multiple questions, as per our guidelines we are supposed to answer only…
Q: O224 O 124 O238 176
A: GIVEN DATA, p=0.169CI=0.90α=1-0.90=0.10E=0.04
Q: Managing Ashland MultiComm Services In its continuing study of the 3-For-All subscription…
A: week New Subscriptions Hours Presentation 1 1256 282 Formal 2 1405 336 Formal 3 1103 232…
Q: A high school principal was concerned about the time his students were spending on home work in a…
A: given data, n=50x¯=18.50σ=10.2α=0.10claim :μ<20
Q: of the test statistic, to obtain the P-value, and to state your conclusion. In the past, the mean…
A: Given Population mean μ=8.2, n=40, sample mean x̄=8.4, level of significance ɑ=0.05, standard…
Q: lable data, indicate the lower and upper 80% CI for the ratio between the 2 1 Trt A 1.75 16 a.…
A: Given At 80% confidence interval for the ratio between the two variance
Q: a) For the first poll, one thousand randomly chosen people were in- terviewed and 368 of them said…
A: It is given that First poll: Favourable cases, X = 368 Sample size, n = 1000 Second poll: kth%…
Q: A chain of restaurants has historically had mean wait time of 9 minutes for its customers. Recently,…
A: There are two parts of statistical inference. These are testing of hypothesis and estimation. In…
Q: Assume that the probability of the binomial random variable will be approximated using the normal…
A: Let X follows Binomial distribution. We have to compute the probability that X = 4 I.e P(X = 4).
Q: Thanks to an initiative to recruit top students, an administrator at a college claims that this…
A: given data,claim: μ>110n=11x¯=112s=15α=0.05one- tailed test
Q: Use the discrete probability distribution below to find the probability that x equals 4. 9 0.12 X 3…
A: Given, X 3 4 6 9 P(X) 0.06 0.05 0.12
Q: Compared to a repeated measures design, which of the following is an advantage of an…
A: Repeated measure involves the study of variable based on the different measures. That is each…
Q: For part a), do we need to solve it with one-way anova or two-way anova?
A: It is required to test whether mean protopectin content is different for four different type of…
Q: QUESTION 13 You are interested in seeing whether emotions impact decision making. You have three…
A: The question is about ANOVA Given : Sum of sq. between samples ( SSG )= 1.6 Sum of sq. within…
Q: Coca-Cola is producing 2-Liter bottles of Coke, Sprite, and Fanta. During bottling, each bottles…
A: Given information- Population mean, µ = 2 liters Population standard deviation, σ = 4 milliliters =…
Q: Below is a graph of a normal distribution with mean μ = -4 and standard deviation =2. The shaded…
A:
Q: May I know how to solve a) and d)?
A: Given Information: Control group: Sample size n1=17 Sample size x¯1=116 Sample standard deviation…
Q: The following is the ANOVA data obtained from a balanced CRD: ANOVA: Source of Variation Degree of…
A: Given Level of significance=0.01,dferror=20, dftotal=42
Q: An experiment involves dropping a ball and recording the distance it falls (y) for different times…
A: Given: n = 6 Formula Used: The equation of linear models: Y = a + bX b = n∑XY-∑X∑Yn∑X2-∑X2 a =…
Q: None of the answers are eligible. The answers have to be either 0, 1, 2, 3, or 4
A: the tree diagram :
Q: The linear correlation coefficient is (Round to three decimal places as needed.)
A: It is given that The regression equation is Highway = 50.3 - 0.00539 Weight The 95% CI is (…
Q: If n=580 and ˆpp^ (p-hat) = 0.5, construct a 99% confidence interval. Give your answers to three…
A:
Q: Several companies have been developing electronic guidance systems for cars. Motorola and Germany's…
A: The following information has been provided: Drug group Placebo Group No-treatment group 12 44…
Q: 11. In semiconductor manufacturing, wet chemical etching is often used to remove silicon from the…
A: Given: The following data is provided: Wafer Solution 1 Solution 2 1 9.9 10.2 2 9.4 10.6 3…
Q: 30 tickets are sold and three prizes are to be awarded, find the probability that one person will…
A: Given Total tickets=30
Q: Problem B: Suppose that Cities A, B and C have the following observed number of COVID19 cases.…
A: Problem B Given The data is as follows: City A B C COVID19 cases 400 450 500
Q: After getting trounced by your little brother in a children's game, you suspect the die he gave you…
A: Under null Hypothesis, If the dice is fair, P(1)=P(2)=P(3)=P(4)=P(5)=P(6)=1/6 Given information:…
Q: Q4) Assume you administered a test in September and then again in November. You obtained a…
A: Given that Assume you administered a test in September and then again in November. You obtained a…
Q: Problem I) Given the random variable, Yhas the following CDF: Fy(y) 1 0.75 0.5 0.25 a) Find Pu(u).…
A: Problem 1) The CDF of Y is FY(y)=0y<10.251≤y<20.52≤y<31y≥3 From the graph of CDF of Y, we…
Q: There are eight patients waiting in a doctor's waiting room. They have been waiting for 9 minutes,…
A: We have given following data x : 9,2,5,4,12,7,8,11 We have to calculate the sample variance for the…
Q: à 12-in. bar that is clamped at both ends is to be sub- ected to an increasing amount of stress…
A:
Q: Assume that the following data represent baseball batting averages (multiplied by 1000) for a random…
A: Solution-: Make a frequency table showing class limits, class boundaries, midpoints and frequency.…
Q: The accounting department of Plank Inc. has been asked to estimate the average salaries of its…
A: We have given that Salaries in thousands of US$ are 2298 2470 2407 2548 2099
Q: A. What is the correlation between mortality and prevalence rates and how do you interpret it?…
A: Given data: Mortality Rate (Y) Prevalence Rate (X) 0.008 0.082 0.008 0.056 0.009 0.067…
Q: To test Ho: μ = 100 versus H₁: μ#100, a simple random sample size of n = 22 is obtained from a…
A: It is given that Sample size n = 22 Sample mean M = 104.6 Sample SD s = 9.6 Level of significance =…
Q: (e) Use a smoothing constant of a 0.4 to compute the exponential smoothing forecasts. Time Series…
A: Given information, The smoothing constant is α=0.4 Week Time series value Forecast 1 19 2…
Q: Click the icon to view the t-Distribution Area in the Right Tail. (a) State the null and alternative…
A: It is given that Population mean = 511 Sample mean, M = 518 Standard deviation = 114 Sample size =…
Q: Compute the linear correlation coefficient between the two variables and determine whether a linear…
A: We have given that, The data set are, X:- 6, 7, 14, 11, 12, 19, 7, 5, 15 Y:- 26, 28, 73, 57, 60,…
Q: Is memory ability before a meal the same as after a meal? len people were given memory tests before…
A: Note: “Since you have posted multiple questions, we will provide the solution only to the specified…
Q: Problem 5) Let Xhave the binomial PMF P₂(x)=(X)* a) Find the standard deviation of the random…
A: Note: According to Bartleby guidelines expert solve only one question and maximum three subpart of…
Q: The duration of video screen time on the iPhone 13 is normally distributed with a mean of 19 hours…
A: GivenMean(μ)=19standard deviation(σ)=1.25
Q: 4. The burning time (in minutes) of heaters used in the protection of orchards from frost is…
A: In testing of hypothesis, there are two hypotheses - null and alternative. These two hypotheses…
Q: Home Internet Access According to a study, 75% of adults ages 18-29 years had broadband Internet…
A: According to the given information, we have Given that a researcher wanted to estimate the…
Q: 1. The following data are average yields in bushels per acre on four plots of land for four…
A: Given data is: Variety 1: 68.8, 76.9, 74.3, 78.7Variety 2: 86.8, 75.7, 77.9, 76.2Variety 3: 90.2,…
Q: 7) Given the following data, answer the questions below. X₁ 2 6 9 13 20 Yi 7 18 9 26 23 The…
A: 7) Solution: The estimated regression equation is y^=7.6+0.9x
Q: Suppose you wish to find out the answer to the age-old question, "Do people prefer Cola 1 or Cola…
A:
Q: d) With the assumption in (c), perform a hypothesis test to see whether the mean LDL cholesterol…
A: Given: Control group: Sample size n1=17 Sample size x¯1=116 Sample standard deviation s1=18.1…
Q: Using regression, Strawstyle Company's accountant prepared the following computer printout to…
A: Given: The output on estimation of overhead costs is provided. We need to interpret the coefficient…
Q: Listed below, from left to right and then top to bottom, are numbers of law enforcement fatalities…
A: Run test is the type of non parametric test. It used to determine whether the data follow random…
Q: For items 10-15: A study was conducted to investigate the interactions between California sheephead,…
A: Introduction: It is required to identify the type of effect component between sheephead biomass to…
Trending now
This is a popular solution!
Step by step
Solved in 2 steps with 1 images
- The following table summarizes the results from a two-factor study with 2 levels of factor A and 3 levels of factor B using a separate sample of n = 8 participants in each treatment condition. Fill in the missing values. (Hint: Start with the df values.) Source SS df MS F Between treatments 72 Factor A Factor B 6 A*B interaction 12 Within treatments 126 Total2. If an individual with the genotype Yy Ww Pp ee Bb is crossed with another individual with the same genotype, what proportion of offspring will be homozygous recessive at all genes? Answers: 1/1024 5/128 1/256 3/16 1/16 3. If an individual with genotype Yy Ww Pp ee Bb is crossed with an individual with the same genotype, what proportion of offspring will have the dominant phenotype for the four heterozygous loci? answers: 81/256 81/128 27/256 3/16The following table summarizes the results from a two-factor study with two levels of factor A and four levels of factor B using a separate sample of n=5 participants in each treatment condition. Fill in the missing values. Determine if any of the F-statistics are significant at . Source SS df MS Between Treatments ____ ____ Factor A 20 ____ ____ F=____ Factor B __ ____ 12 F=____ AxB Interaction ____ ____ 6 F=____ Within Treatments 64 ____ ____ Total ____ ____
- The following table summarizes the results from a two-factor study with two levels of factor A and three levels of factor B using a separate sample of n=5 participants in each treatment condition. Fill in the missing values.15 It is desired to investigate the status of participation in business development trainings in a factory. According to these results, which of the following is the hypothesis of the hypothesis that the age factor is effective in participation in education? a) Since χ2 is the calculated < χ2 table value, Hs is rejected. B) Ho is rejected because χ2 is the calculated < χ2 table value. NS) Ho is rejected since χ2 calculated = χ2 table value. D) Ho is rejected since χ2 is the calculated > χ2 table value. TO) Since χ2 is the calculated > χ2 table value, Hs is accepted.A gambler claims that horses in a horse race that start closer to the rail have an advantage over horses that start further from the rail because the horses closer to the rail have a shorter distance to travel to win the race. And a sample of 120 races, the following data show the number of winners from each starting position. If the starting position is not a factor that each starting position should have produce 20 winners.  a) test the hypothesis that the 5% level of significance to see if the starting position is a factor
- The following table summarizes the results from a two-factor study with two levels of factor A and four levels of factor B using a separate sample of n = 5 participants in each treatment condition. (Hint: Start with the df values.) Source SS df MS F Between treatments A 48 B 24 A x B 12 Within treatments 144 TotalAn industrial-organizational psychologist believes that implementing a 2-hour lunch break at US companies will have an effect on employee productivity. On a productivity scale from 1 to 15, the average productivity score for all companies in the US is 8 (u = 8.00, ỡ = 4.00). The IO psychologist randomly samples 5 companies and has the companies implement a 2-hour lunch break for 1 month. At the end of the month, the lO psychologist measures the productivity scores for the five companies and obtains the following scores: 9, 14, 10, 12, 15 Using the appropriate hypothesis test and the six steps of hypothesis testing, determine what the 10 psychologist should conclude about the effect of a 2-hour lunch break on employee productivity. 1) What are the null and alternative hypotheses 2)Construct a sampling distribution of means representing the null hypothesis. Specify the sampling distribution's mean and standard error 3)Using a two-tailed alpha of .05 (a = 05), determine the critical…An industrial-organizational psychologist believes that implementing a 2-hour lunch break at US companies will have an effect on employee productivity. On a productivity scale from 1 to 15, the average productivity score for all companies in the US is 8 (u = 8.00, ỡ = 4.00). The IO psychologist randomly samples 5 companies and has the companies implement a 2-hour lunch break for 1 month. At the end of the month, the lO psychologist measures the productivity scores for the five companies and obtains the following scores: 9, 14, 10, 12, 15 Using the appropriate hypothesis test and the six steps of hypothesis testing, determine what the 10 psychologist should conclude about the effect of a 2-hour lunch break on employee productivity. 1. What is the appropriate test to use ? 2. List the test's assumptions .You do NOT have to test the assumptions. 3. What are the null and alternative hypotheses ? 4. Construct a sampling distribution of means representing the null hypothesis. Specify the…
- An industrial-organizational psychologist believes that implementing a 2-hour lunch break at US companies will have an effect on employee productivity. On a productivity scale from 1 to 15, the average productivity score for all companies in the US is 8 (u = 8.00, ỡ = 4.00). The IO psychologist randomly samples 5 companies and has the companies implement a 2-hour lunch break for 1 month. At the end of the month, the lO psychologist measures the productivity scores for the five companies and obtains the following scores: 9, 14, 10, 12, 15 Using the appropriate hypothesis test and the six steps of hypothesis testing, determine what the 10 psychologist should conclude about the effect of a 2-hour lunch break on employee productivity. 1. What is the appropriate test to use ? 2. List the test's assumptions .You do NOT have to test the assumptions. 3. What are the null and alternative hypotheses ? 4. Construct a sampling distribution of means representing the null hypothesis. Specify the…An industrial-organizational psychologist believes that implementing a 2-hour lunch break at US companies will have an effect on employee productivity. On a productivity scale from 1 to 15, the average productivity score for all companies in the US is 8 (u = 8.00, ỡ = 4.00). The IO psychologist randomly samples 5 companies and has the companies implement a 2-hour lunch break for 1 month. At the end of the month, the lO psychologist measures the productivity scores for the five companies and obtains the following scores: 9, 14, 10, 12, 15 Using the appropriate hypothesis test and the six steps of hypothesis testing, determine what the 10 psychologist should conclude about the effect of a 2-hour lunch break on employee productivity. 1) write out the null and alternative hypotheses 2) Use an online calculator to calculate the exact p-valueAn industrial-organizational psychologist believes that implementing a 2-hour lunch break at US companies will have an effect on employee productivity. On a productivity scale from 1 to 15, the average productivity score for all companies in the US is 8 (u = 8.00, ỡ = 4.00). The IO psychologist randomly samples 5 companies and has the companies implement a 2-hour lunch break for 1 month. At the end of the month, the lO psychologist measures the productivity scores for the five companies and obtains the following scores: 9, 14, 10, 12, 15 1. State whether you reject or fail to reject the null hypothesis 2. Use an online calculator to calculate the exact p-value 3. Calculate and report the effect size 4. Based on the results of your analysis, does a 2-hour lunch break increase, decrease, or have no effect on productivity ?