Step 3 keep getting that one wrong

Glencoe Algebra 1, Student Edition, 9780079039897, 0079039898, 2018
18th Edition
ISBN:9780079039897
Author:Carter
Publisher:Carter
Chapter10: Statistics
Section10.4: Distributions Of Data
Problem 19PFA

Related questions
Question
Step 3 keep getting that one wrong
Transcribed Image Text:myopenmath.
assess2/?čid=101459&aid=7240148#/skip/2
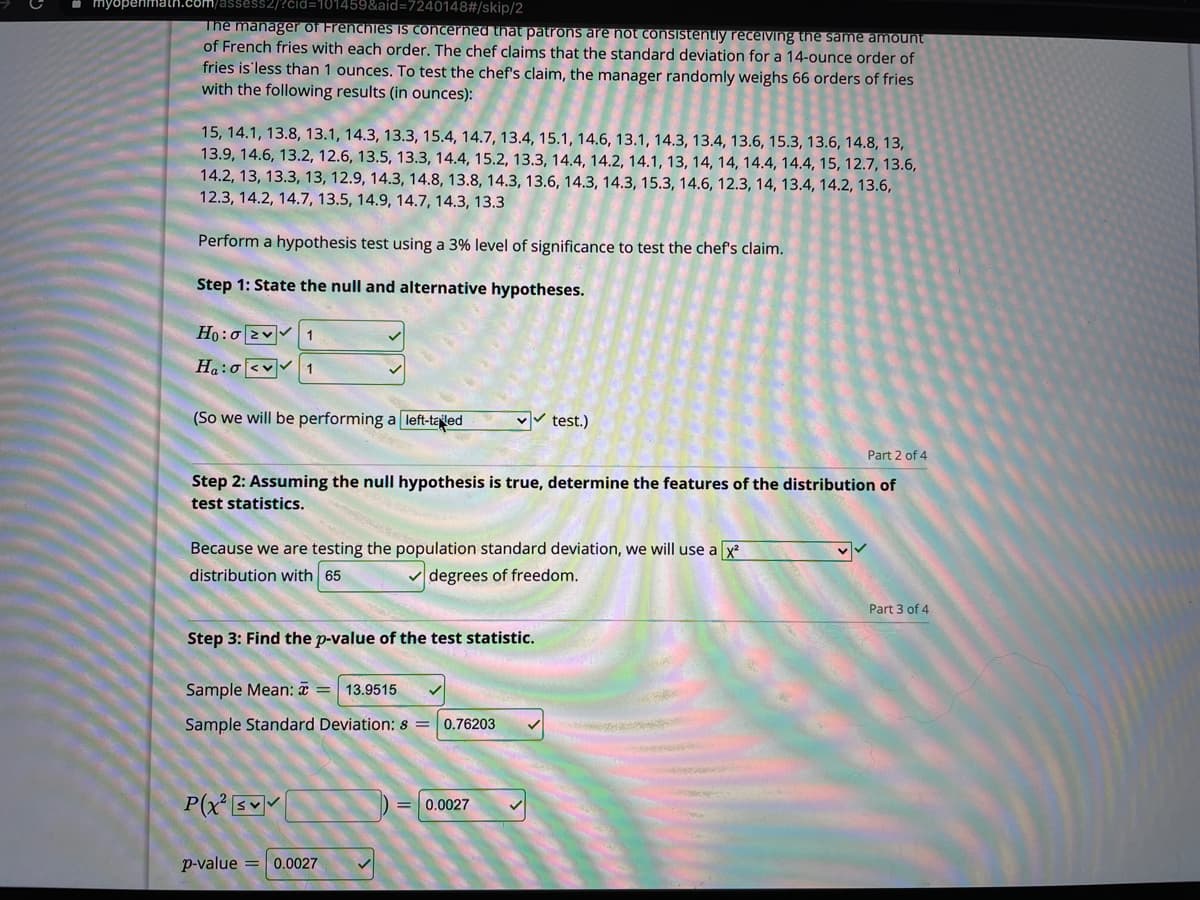
The manager of Frenchies IS concerned that patrons are hot consistently receiving the same amount
of French fries with each order. The chef claims that the standard deviation for a 14-ounce order of
fries is'less than 1 ounces. To test the chef's claim, the manager randomly weighs 66 orders of fries
with the following results (in ounces):
15, 14.1, 13.8, 13.1, 14.3, 13.3, 15.4, 14.7, 13.4, 15.1, 14.6, 13.1, 14.3, 13.4, 13.6, 15.3, 13.6, 14.8, 13,
13.9, 14.6, 13.2, 12.6, 13.5, 13.3, 14.4, 15.2, 13.3, 14.4, 14.2, 14.1, 13, 14, 14, 14.4, 14.4, 15, 12.7, 13.6,
14.2, 13, 13.3, 13, 12.9, 14.3, 14.8, 13.8, 14.3, 13.6, 14.3, 14.3, 15.3, 14.6, 12.3, 14, 13.4, 14.2, 13.6,
12.3, 14.2, 14.7, 13.5, 14.9, 14.7, 14.3, 13.3
Perform a hypothesis test using a 3% level of significance to test the chef's claim.
Step 1: State the null and alternative hypotheses.
Ho:0 2v 1
Ha:o <v 1
(So we will be performing a left-taled
v test.)
Part 2 of 4
Step 2: Assuming the null hypothesis is true, determine the features of the distribution of
test statistics.
Because we are testing the population standard deviation, we will use a x
distribution with 65
V degrees of freedom.
Part 3 of 4
Step 3: Find the p-value of the test statistic.
Sample Mean: a
13.9515
Sample Standard Deviation: s = 0.76203
P(x s
0.0027
p-value = 0.0027
Expert Solution
This question has been solved!
Explore an expertly crafted, step-by-step solution for a thorough understanding of key concepts.

Step by step
Solved in 3 steps

Knowledge Booster


Learn more about
Need a deep-dive on the concept behind this application? Look no further. Learn more about this topic, statistics and related others by exploring similar questions and additional content below.Recommended textbooks for you
Glencoe Algebra 1, Student Edition, 9780079039897…
Algebra
ISBN:
9780079039897
Author:
Carter
Publisher:
McGraw Hill
Glencoe Algebra 1, Student Edition, 9780079039897…
Algebra
ISBN:
9780079039897
Author:
Carter
Publisher:
McGraw Hill