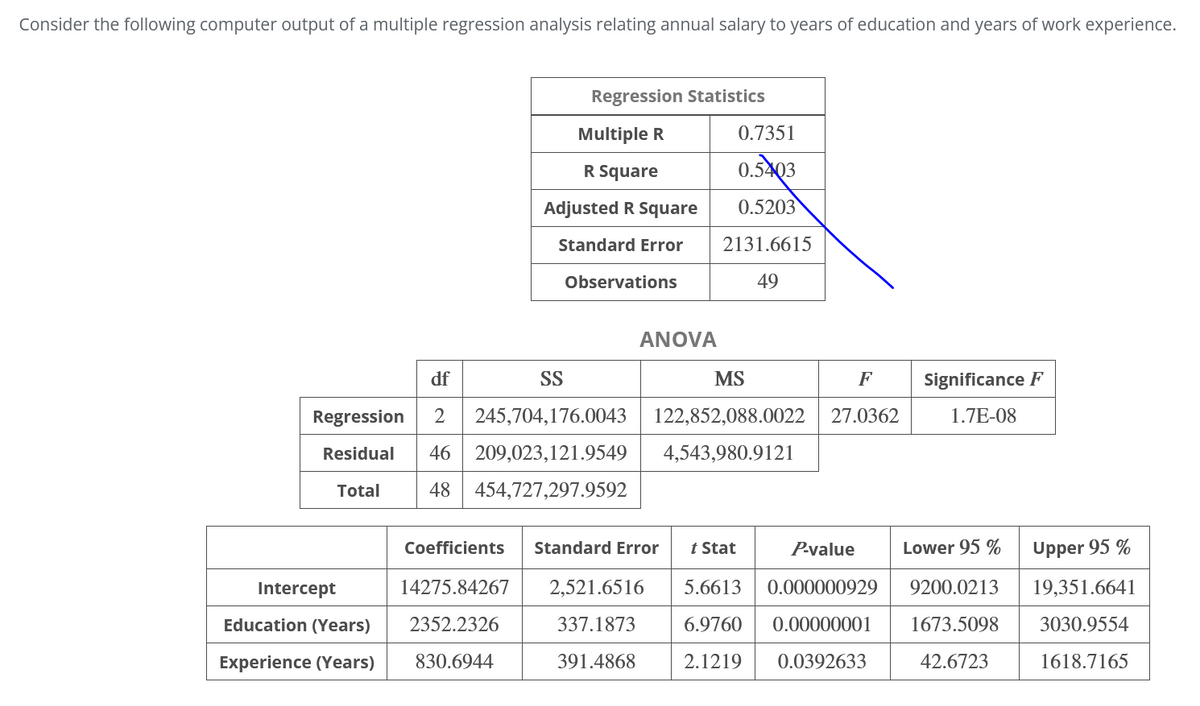
Step 1 of 2 : What would be your expected salary with no education and no experience?


Q: QUESTION 7 A buyer purchases a job lot of 500 children's jeans, 380 pairs costing $14 each and 120…
A: Please see the solution in Step 2. According to question-answer guidelines I suppose to solve the…
Q: Based on the graph, does there appear to be evidence of a main effect for mixer speed? A. Yes,…
A: Note: Hi there! Thank you for posting the question. As you have posted multiple questions, as per…
Q: The graphs below give the diabetes mortality rate for countries with low per capita income and…
A: Given that,
Q: The degrees of freedom are directly related to
A: Let, X1,X2,...,Xn be the samples from normal distribution. Let, S2 be the sample variance. We know…
Q: How far would Boribun need to be from her house for a purchase to be flagged as an outlier? Clearly…
A:
Q: Which of the following best describes the picture?
A: Intro.: The given plot is interaction plot. The interaction between two factors defined as the…
Q: For each of the following data sets, construct a scatter plot, draw a line of best fit, use two…
A:
Q: Because the vertical scale starts with a frequency of 200 instead of 0, the difference between the…
A: This graph depicts the result on data from TE connectivity which seems to be misleading with no…
Q: Given the following data, find the value of D3
A:
Q: 16 30
A: In a right angle triangle, the longest side is called hypotenuse. The side which is opposite to the…
Q: 2 shows the presidential salary that each US President earned in his first year in office. Which US…
A: The median is the middle value of the ordered data-set. Total number of observations (n)= 5 The data…
Q: scatterplot
A: The Given data is collected on time spent by the student in study and time spent on campus life…
Q: Write a mathematical scenario to describe each of the scatter plots 20
A: Scatterplot is a diagrammatic representation to exhibit the relation between two variables, where…
Q: Answer the problem below. Veronica is tasked to get the weekly orders of diesel from different…
A: Given: Station A Mon 24 Tues 56 Wed 33 Thurs 45 Fri 40 Sat 42 Sun 39…
Q: The Ultimate Trade Discount A General Motors incentive program designed to reduce the inventory of…
A:
Q: Survey questions may be misleading if they are "loaded." To what does "loaded" refer?
A: Survey is a method of data collection which can be qualitative or quantitative. It is used to gather…
Q: Consider the chart to the right What is the greatest single expense category? To the nearest degree,…
A:
Q: ) Convert each exam score to a standard score z. ) On which test did he do better compared to the…
A: It is given that For accounting, score = 116, mean = 102, SD = 14 For biology, score = 82, mean =…
Q: Step 3: Find the p-value of the point estimate. First identify the ohserved andlexpected values
A: Step 3: From the given information, Ethnicity Observed values(O) Proportion(p) Expected…
Q: Referring to Table 12-11, which of the following is the correct alternative hypothesis for testing…
A: For the given question , The Null Hypothesis would be that there is not a significant relationship…
Q: If the points on the scatter diagram show no tendency either to increase together or decrease…
A: Scatter Plot: A scatter plot is a graphical representation of data that displays the relationship…
Q: Question 23 Calculate the Laspeyres Quantity Index, Lq. А 106.95 В 102.93 C 108.06 D 105.97
A: To find the laspeyres quantity index number formula is defined as below Where, Lq =…
Q: the length of time taken to run 100m a continous data?
A: Variables is of two types: qualitative data and quantitative data. Qualitative data represents…
Q: The brand manager for a brand of toothpaste must plan a campaign designed to increase brand…
A: Obtain the critical value at 95% confidence level:It is given that the confidence level is 0.95 and…
Q: Based on the scatterplot, which equation BEST represents these da
A: Given that:
Q: Illustration 22. Given below are the data relating to the vearly sales of a retail shop : 1998 140…
A:
Q: Use the data given to solve the following problems. Savings needed for Health-Care Expenses During…
A:
Q: For the Dakota problem: a. Solve Dakota's LP and run a sensitivity analysis. b. If 18 finishing…
A:
Q: Complete the following table of values. (You should be able to notice a pattern.) Number of Total…
A: Hi, Thank you for the question. Since you have posted multiple questions as per the rule we will…
Q: QUESTION 20 The percent markup on the cost proce of a dress is the same as the cost proce in…
A:
Q: To get the best deal on an appliance, Jeremy called six appliance stores and asked the cost of a…
A: Given data is$119 , $488 , $227 , $644 , $344 , $266
Q: Plot the following six points: (- 2, 2) (1, 5) (– 5, – 1) (1, 0) (4, - 4) (0, – 3)
A: The direction on the graph of x-axis and y-axis is given below. The origin is (0,0). The horizontal…
Q: The estimated score will be between
A: Here given regression equation of hours of studies and test score
Q: The table below gives the number of hours spent studying for a science exam and the final exat…
A: Given information: The data represents the values of the variables X = Study hours and Y = Grade.
Q: Which model appears to be the best accordingly? A. Model I B. Model II C. Model III D. Model IV
A: Given are a few Linear Models and their Error Sum of Squares.
Q: Which scatterplot best shows the relationship between a person's height and the time that person…
A: theory explanation:
Q: Are the following figures similar? Remember to reduce.
A: Note : As per our we are supposed to answer only one question. Kindly repost other question as the…
Q: What does Simple Effect reflects?
A: Given a simple regression line there are two variables in the equation, X (response variable) which…
Q: A survey of 18 people is carried out to understand about their working life. The results are shown…
A:
Q: Use the Sales information above to answer this question. How many thingamabobs should Yaster Inc.…
A:
Q: Based on the scatter plot above, answer the following: 1. Can you describe the relationship between…
A: The relation between temperature and number of ice creams sold are positively correlated, hence as…
Q: The Pennsylvania State University had enrollments of 40,571 students in 2000 and 41,289 students in…
A:
Q: Name the forecasting methods
A: There are two types of forecasting methods. 1) Quantitative methods 2) Qualitative methods There are…
Q: question 1 Porshe shoes Store sells a shoes with discounts of 15 percent and 20 percent, while Judy…
A: Given; Porshe shoes Store sells a shoes with discounts of 15 percent and 20 percent, while Judy…
Q: The brand manager for a brand of toothpaste must plan a campaign designed to increase brand…
A:
Q: Question 2 Classify the data as quantitative or qualitative? a) weights(in pounds) in a Gym class?…
A:
Q: Illustration 13,1. Construct index numbers of prices from the following data using (a) Laspeyre's…
A:
Q: Cite any relevant observation/s from the diagram below.
A: Here given graph for observation hour and acetone concentration
Q: If we multiply the data values by a constant (say, c), how this will affect the geometric mean? Use…
A: From the given information, It has been given that,
Review image and answer the following:


Trending now
This is a popular solution!

Step by step
Solved in 2 steps with 2 images

- Olympic Pole Vault The graph in Figure 7 indicates that in recent years the winning Olympic men’s pole vault height has fallen below the value predicted by the regression line in Example 2. This might have occurred because when the pole vault was a new event there was much room for improvement in vaulters’ performances, whereas now even the best training can produce only incremental advances. Let’s see whether concentrating on more recent results gives a better predictor of future records. (a) Use the data in Table 2 (page 176) to complete the table of winning pole vault heights shown in the margin. (Note that we are using x=0 to correspond to the year 1972, where this restricted data set begins.) (b) Find the regression line for the data in part ‚(a). (c) Plot the data and the regression line on the same axes. Does the regression line seem to provide a good model for the data? (d) What does the regression line predict as the winning pole vault height for the 2012 Olympics? Compare this predicted value to the actual 2012 winning height of 5.97 m, as described on page 177. Has this new regression line provided a better prediction than the line in Example 2?Consider the following computer output of a multiple regression analysis relating annual salary to years of education and years of work experience. Regression Statistics Multiple R 0.73520.7352 R Square 0.54050.5405 Adjusted R Square 0.52050.5205 Standard Error 2131.18202131.1820 Observations 4949 ANOVA dfdf SSSS MSMS F� Significance F� Regression 22 245,793,126.4218245,793,126.4218 122,896,563.2109122,896,563.2109 27.058227.0582 1.7E-081.7E-08 Residual 4646 208,929,085.5374208,929,085.5374 4,541,936.64214,541,936.6421 Total 4848 454,722,211.9592454,722,211.9592 Coefficients Standard Error t� Stat P-value Lower 95%95% Upper 95%95% Intercept 14268.6823614268.68236 2,521.08442,521.0844 5.65975.6597 0.0000009340.000000934 9194.00279194.0027 19,343.362119,343.3621 Education (Years) 2352.26982352.2698 337.1115337.1115 6.97776.9777 0.000000010.00000001 1673.69951673.6995 3030.84013030.8401 Experience (Years) 832.2096832.2096…Consider the following computer output of a multiple regression analysis relating annual salary to years of education and years of work experience. Regression Statistics Multiple R 0.73650.7365 R Square 0.54240.5424 Adjusted R Square 0.52250.5225 Standard Error 2124.60962124.6096 Observations 4949 ANOVA dfdf SSSS MSMS F� Significance F� Regression 22 246,127,958.1791246,127,958.1791 123,063,979.0896123,063,979.0896 27.262927.2629 1.6E-081.6E-08 Residual 4646 207,642,442.8821207,642,442.8821 4,513,966.14964,513,966.1496 Total 4848 453,770,401.0612453,770,401.0612 Coefficients Standard Error t� Stat P-value Lower 95%95% Upper 95%95% Intercept 14256.268814256.2688 2,513.30952,513.3095 5.67235.6723 0.0000008950.000000895 9197.23929197.2392 19,315.298419,315.2984 Education (Years) 2353.85412353.8541 336.0719336.0719 7.00407.0040 0.0000000090.000000009 1677.37651677.3765 3030.33173030.3317 Experience (Years) 832.8371832.8371…
- Consider the following computer output from a multiple regression analysis relating the price of a used car to the variables: age of car, mileage, and safety rating. Coefficients Coefficients Standard Error t� Stat P-value Intercept 42465.6942465.69 5320.545320.54 7.9817.981 0.00000.0000 Age (Year) −21096.02−21096.02 2551.522551.52 −8.268−8.268 0.00000.0000 Mileage(in Thousands) −1312.73−1312.73 103.02103.02 −12.743−12.743 0.00000.0000 Safety Rating 1533.821533.82 165.72165.72 9.2559.255 0.00000.0000 Does the sign of the coefficient for the variable safety rating make sense?The following data is a regression model where the U.S. Department of Transportation has tried to relate the rate of fatal traffic accidents (per 1000 licenses) to the percentage of motorists under the age of 21. Data has been collected for 42 major cities in the United States. SUMMARY OUTPUT Regression Statistics Multiple R 0.83938748 R Square 0.70457134 Adjusted R Square 0.69718562 Standard Error 0.58935028 Observations 42 ANOVA df SS MS F Regression 1 33.13441764 33.1344 95.3964 Residual 40 13.89335048 0.34733 Total 41 47.02776812 Coefficients Standard Error t Stat P-value Intercept -1.5974138 0.371671454 -4.2979 0.00010 Percent Under 21 0.28705317 0.029389769 9.76711 3.79E-9…If the standard error of the estimate for a regression model fitted to a large number of paired observations is 1.75, approximately 95% of the residuals would lie within ______. −3.50 and +3.50 −1.75 and +1.75 −0.95 and +0.95 −0.68 and +0.68 −0.97 and +0.97
- Calculate the R2of the following multivariate sample regression functions and interpret theanswers.3.1 Investment-hat = β1-hat + β2-hat*Interest rate + β3-hat*Exchange rateESS = 900RSS = 1003.2 Investment-hat = β1 + β2-hat*Interest rate + β3-hat*number of 311 studentsESS = 400RSS = 6003.3 Salary-hat = β1 + β2-hat*Frequency of blinking eyes + β3-hat*Colour of hairRSS = 950TSS = 1000A part of the output of a regression analysis of Y against X using Excel is given below:SUMMARY OUTPUTRegression StatisticsMultiple R 0.954704R Square 0.91146Adjusted R Square 0.896703Standard Error 28.98954Observations 8ANOVAdf SS MS F Significance FRegression 1 51907.64 51907.64Residual 6 5042.361 840.3936Total 7 56950Coefficients Standard Error t Stat P-valueIntercept 45.2159 39.8049Age 5.3265 0.6777a. State the estimated regression line and interpret the slope coefficient.The following is a partial computer output of a multiple regression analysis of a data set containing 20 sets of observations on the dependent variableThe regression equation isSALEPRIC = 1470 + 0.814 LANDVAL + 0.820 IMPROVAL + 13.5 AREA Predictor Coef SE Coef T P Constant 1470 5746 0.26 0.801 LANDVAL 0.8145 0.5122 1.59 0.131 IMPROVAL 0.8204 0.2112 3.88 0.0001 AREA 13.529 6.586 2.05 0.057 S = 79190.48 R-Sq = 89.7% R-Sq(adj) = 87.8% Analysis of Variance Source DF SS MS Regression 3 8779676741 2926558914 Residual Error 16 1003491259 62718204 Total 19 9783168000 For the problem above, we want to carry out the significance test about the coefficient of LANDVAL, what is the t-value for this test, and is it significant? 46.66, significant 2.05, significant 1.59, not significant 0.26, not significant
- Consider the following computer output from a multiple regression analysis relating the price of a used car to the variables: age of car, mileage, and safety rating. Coefficients Coefficients Standard Error t� Stat P-value Intercept 38356.1138356.11 4686.294686.29 8.1858.185 0.00000.0000 Age (Year) −18219.29−18219.29 2196.312196.31 −8.295−8.295 0.00000.0000 Mileage(in Thousands) 1149.561149.56 1897.651897.65 0.6060.606 0.54720.5472 Safety Rating 1396.751396.75 159.64159.64 8.7498.749 0.00000.0000 Does the sign of the coefficient for the variable mileage make sense?The Following data is given for the period 1999-2003 Interest rate Inflation i π 1999 4.7 4.4 2000 4.6 5.4 2001 6.3 5.7 2002 4.8 4.6 2003 2.9 2.4 Obtain residuals of the regression. Calculate variance of the residuals and the standard errors of the parametersA researcher notes that, in a certain region, a disproportionate number of software millionaires were born around the year 1955. Is this a coincidence, or does birth year matter when gauging whether a software founder will besuccessful? The researcher investigated this question by analyzing the data shown in the accompanying table. Complete parts a through c below. a. Find the coefficient of determination for the simple linear regression model relating number (y) of software millionaire birthdays in a decade to total number (x) of births in the region. Interpret the result. The coefficient of determination is 1.___? (Round to three decimal places as needed.) This value indicates that 2.____ of the sample variation in the number of software millionaire birthdays is explained by the linear relationship with the total number of births in the region. (Round to one decimal place as needed.) b. Find the coefficient of determination for the simple linear regression model…
