Which of the following best describes the picture?

Glencoe Algebra 1, Student Edition, 9780079039897, 0079039898, 2018
18th Edition
ISBN:9780079039897
Author:Carter
Publisher:Carter
Chapter4: Equations Of Linear Functions
Section: Chapter Questions
Problem 8SGR

Related questions
Question
3
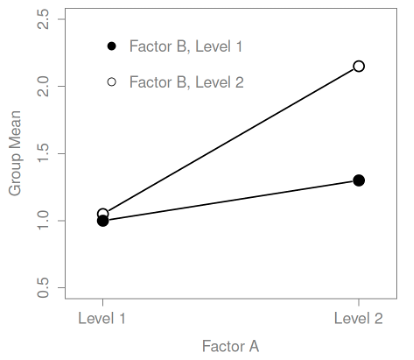
Transcribed Image Text:Factor B, Level 1
o Factor B, Level 2
Level 1
Level 2
Factor A
Group Mean
0.5
1.0
1.5
2.0
2.5
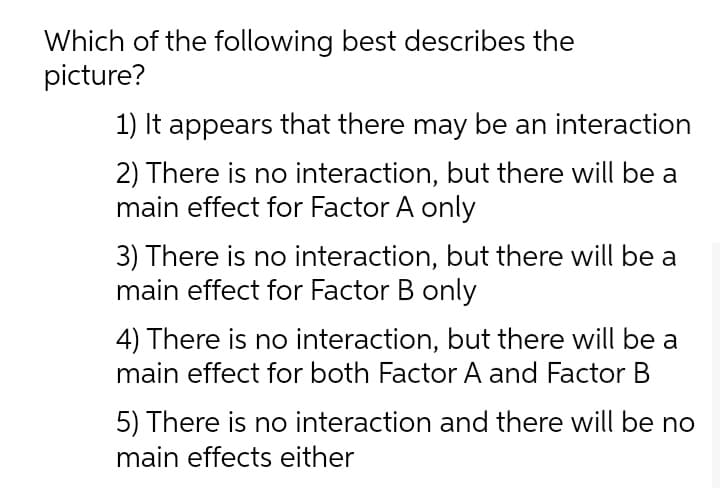
Transcribed Image Text:Which of the following best describes the
picture?
1) It appears that there may be an interaction
2) There is no interaction, but there will be a
main effect for Factor A only
3) There is no interaction, but there will be a
main effect for Factor B only
4) There is no interaction, but there will be a
main effect for both Factor A and Factor B
5) There is no interaction and there will be no
main effects either
Expert Solution
This question has been solved!
Explore an expertly crafted, step-by-step solution for a thorough understanding of key concepts.

Step by step
Solved in 2 steps

Recommended textbooks for you
Glencoe Algebra 1, Student Edition, 9780079039897…
Algebra
ISBN:
9780079039897
Author:
Carter
Publisher:
McGraw Hill
Glencoe Algebra 1, Student Edition, 9780079039897…
Algebra
ISBN:
9780079039897
Author:
Carter
Publisher:
McGraw Hill