Step2 Step 1 Draw the figure and indicate the appropriate area. Given Find the z value which corresponds to the area A left-tailed test with a =0.10. Find the area closest to 0.1000 in z table, In this case, it is 0.1003 the z value which corresponds to the area 0.1003. It is -1.28. For the left z critical value, find the area A two-tailed test with a = 0.02. closest to . or = 0.01. In this case, it is %3D 0.0099. For the right z critical value, find the area closest to 1- or 1- raot case, it is 0.9901. Find the z values for each of the areas. For 0.0099, z = -2.33. For the area of 0.9901, z 0.9901, z = +2.33. a02 = 0.9900. In this -2.33 A right-tailed test with a = 0.005. closest to 1-a, Find 1 - 0.005 = 0.9950. In this case, it is 0.9949 or 0.9951. The two z values corresponding to 0.9949 and 0.9951 are 2.57 and 2.58. the area or -0.990. Since 0.9500 is halfway between these fwo values, find the average of the two values (2.57 +2.58) /2= 2.575. However, 2.58 is most often used. B. Finding Critical valuels. Directions: Using the z table .find the critical value(s) for each situation and draw the appropriate figure, showing the critical region. Step 1 Draw the figure and indicate the appropriate area. Given Step2 Find the z value which corresponds to the area a u = 0.05, two-tailed test b. a =0.01, left-tailed test a = 0.005, right-tailed test C.
Step2 Step 1 Draw the figure and indicate the appropriate area. Given Find the z value which corresponds to the area A left-tailed test with a =0.10. Find the area closest to 0.1000 in z table, In this case, it is 0.1003 the z value which corresponds to the area 0.1003. It is -1.28. For the left z critical value, find the area A two-tailed test with a = 0.02. closest to . or = 0.01. In this case, it is %3D 0.0099. For the right z critical value, find the area closest to 1- or 1- raot case, it is 0.9901. Find the z values for each of the areas. For 0.0099, z = -2.33. For the area of 0.9901, z 0.9901, z = +2.33. a02 = 0.9900. In this -2.33 A right-tailed test with a = 0.005. closest to 1-a, Find 1 - 0.005 = 0.9950. In this case, it is 0.9949 or 0.9951. The two z values corresponding to 0.9949 and 0.9951 are 2.57 and 2.58. the area or -0.990. Since 0.9500 is halfway between these fwo values, find the average of the two values (2.57 +2.58) /2= 2.575. However, 2.58 is most often used. B. Finding Critical valuels. Directions: Using the z table .find the critical value(s) for each situation and draw the appropriate figure, showing the critical region. Step 1 Draw the figure and indicate the appropriate area. Given Step2 Find the z value which corresponds to the area a u = 0.05, two-tailed test b. a =0.01, left-tailed test a = 0.005, right-tailed test C.

MATLAB: An Introduction with Applications
6th Edition
ISBN:9781119256830
Author:Amos Gilat
Publisher:Amos Gilat
Chapter1: Starting With Matlab
Section: Chapter Questions
Problem 1P

Related questions
Question
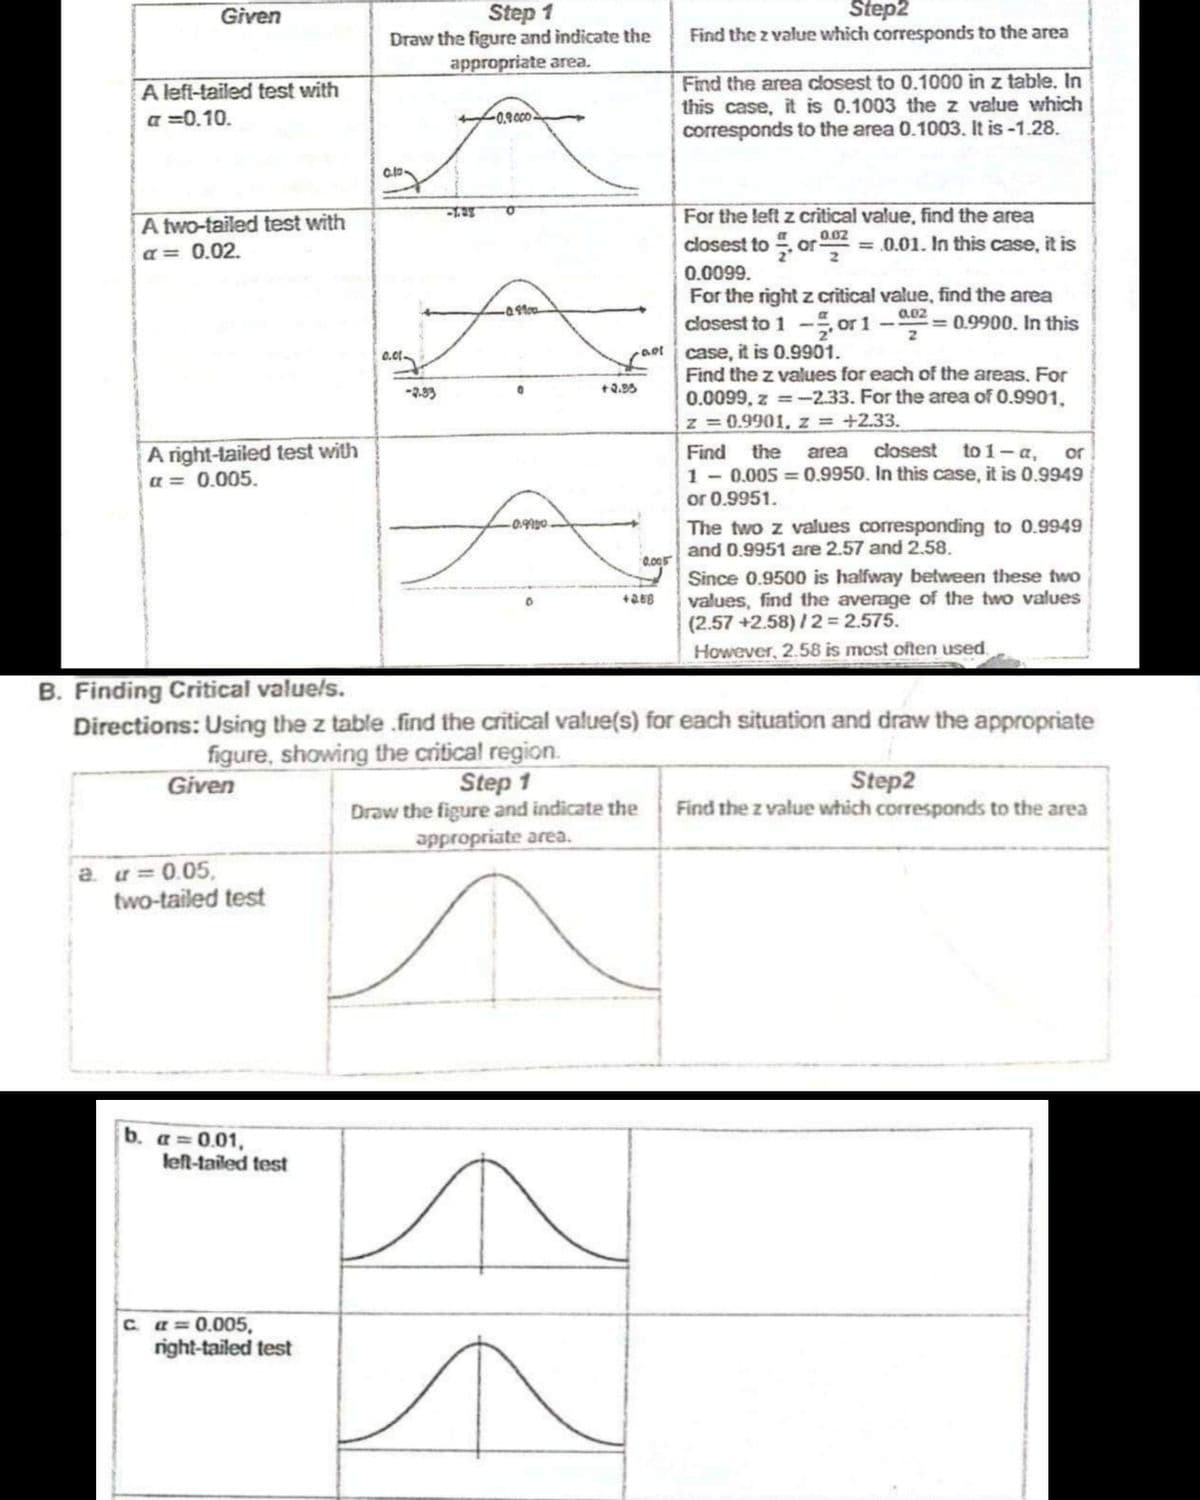
Transcribed Image Text:Step2
Step 1
Draw the figure and indicate the
appropriate area.
Given
Find the z value which corresponds to the area
A left-tailed test with
a =0.10.
Find the area closest to 0.1000 in z table. In
this case, it is 0.1003 the z value which
corresponds to the area 0.1003. It is -1.28.
-0.2000
For the left z critical value, find the area
A two-tailed test with
a = 0.02.
0.02
closest to or
r
= .0.01. In this case, it is
2
0.0099.
For the right z critical value, find the area
closest to 1 - or 1
1ot case, it is 0.9901.
Find the z values for each of the areas. For
0.0099, z = -2.33. For the area of 0.9901,
z = 0.9901, z = +2.33.
a02
= 0.9900. In this
2
0.01.
+2.95
-2.33
A right-tailed test with
a = 0.005.
Find the
closest to 1- a, or
area
1 - 0.005 = 0.9950, In this case, it is 0.9949
or 0.9951.
%3D
The two z values corresponding to 0.9949
and 0.9951 are 2.57 and 2.58.
0.005
Since 0.9500 is halfway between these two
values, find the average of the two values
(2.57 +2.58) / 2= 2.575.
However, 2.58 is most often used.
B. Finding Critical valuels.
Directions: Using the z table .find the critical value(s) for each situation and draw the appropriate
figure, showing the critical region.
Given
Step 1
Step2
Draw the figure and indicate the Find the z value which corresponds to the area
appropriate area.
a. u = 0.05,
two-tailed test
b. a=0.01,
left-tailed test
Ca=0.005,
right-tailed test
Expert Solution
This question has been solved!
Explore an expertly crafted, step-by-step solution for a thorough understanding of key concepts.

Step by step
Solved in 2 steps with 1 images

Recommended textbooks for you
MATLAB: An Introduction with Applications
Statistics
ISBN:
9781119256830
Author:
Amos Gilat
Publisher:
John Wiley & Sons Inc

Probability and Statistics for Engineering and th…
Statistics
ISBN:
9781305251809
Author:
Jay L. Devore
Publisher:
Cengage Learning

Statistics for The Behavioral Sciences (MindTap C…
Statistics
ISBN:
9781305504912
Author:
Frederick J Gravetter, Larry B. Wallnau
Publisher:
Cengage Learning
MATLAB: An Introduction with Applications
Statistics
ISBN:
9781119256830
Author:
Amos Gilat
Publisher:
John Wiley & Sons Inc
Probability and Statistics for Engineering and th…
Statistics
ISBN:
9781305251809
Author:
Jay L. Devore
Publisher:
Cengage Learning
Statistics for The Behavioral Sciences (MindTap C…
Statistics
ISBN:
9781305504912
Author:
Frederick J Gravetter, Larry B. Wallnau
Publisher:
Cengage Learning

Elementary Statistics: Picturing the World (7th E…
Statistics
ISBN:
9780134683416
Author:
Ron Larson, Betsy Farber
Publisher:
PEARSON

The Basic Practice of Statistics
Statistics
ISBN:
9781319042578
Author:
David S. Moore, William I. Notz, Michael A. Fligner
Publisher:
W. H. Freeman

Introduction to the Practice of Statistics
Statistics
ISBN:
9781319013387
Author:
David S. Moore, George P. McCabe, Bruce A. Craig
Publisher:
W. H. Freeman