Store 2 733 498 509 741 632 484 758 140 Difference 64 55 (Store 1 - Store 2) 233 38 -76 164 149 74 Send data to calculator ed on these data, can the owner conclude, at the 0.01 level of significance, that the mean daily sales of the two stores differ? Answer this question by forming a hypothesis test regarding Hd (which is u with a letter "d" subscript), the population mean daily sales difference between the two stores. Assume at this population of differences (Store 1 minus Store 2) is normally distributed. form a two-tailed test. Then complete the parts below. Carry your intermediate computations to three or more decimal places and round your answers as ecified. (If necessary, consult a list of formulas.) a) State the null hypothesis Ho and the alternative hypothesis H₁. μ Р Ho :O H₁ [ (b) Determine the type of test statistic to use. Type of test statistic: (Choose one) ▼ (c) Find the value of the test statistic. (Round to three or more decimal places.) decimal places Ix 4 a S X 2 Olo 0=0 OSO 20 >O ☐☐ □<口
Store 2 733 498 509 741 632 484 758 140 Difference 64 55 (Store 1 - Store 2) 233 38 -76 164 149 74 Send data to calculator ed on these data, can the owner conclude, at the 0.01 level of significance, that the mean daily sales of the two stores differ? Answer this question by forming a hypothesis test regarding Hd (which is u with a letter "d" subscript), the population mean daily sales difference between the two stores. Assume at this population of differences (Store 1 minus Store 2) is normally distributed. form a two-tailed test. Then complete the parts below. Carry your intermediate computations to three or more decimal places and round your answers as ecified. (If necessary, consult a list of formulas.) a) State the null hypothesis Ho and the alternative hypothesis H₁. μ Р Ho :O H₁ [ (b) Determine the type of test statistic to use. Type of test statistic: (Choose one) ▼ (c) Find the value of the test statistic. (Round to three or more decimal places.) decimal places Ix 4 a S X 2 Olo 0=0 OSO 20 >O ☐☐ □<口

MATLAB: An Introduction with Applications
6th Edition
ISBN:9781119256830
Author:Amos Gilat
Publisher:Amos Gilat
Chapter1: Starting With Matlab
Section: Chapter Questions
Problem 1P

Related questions
Question
How is it done please show step by step
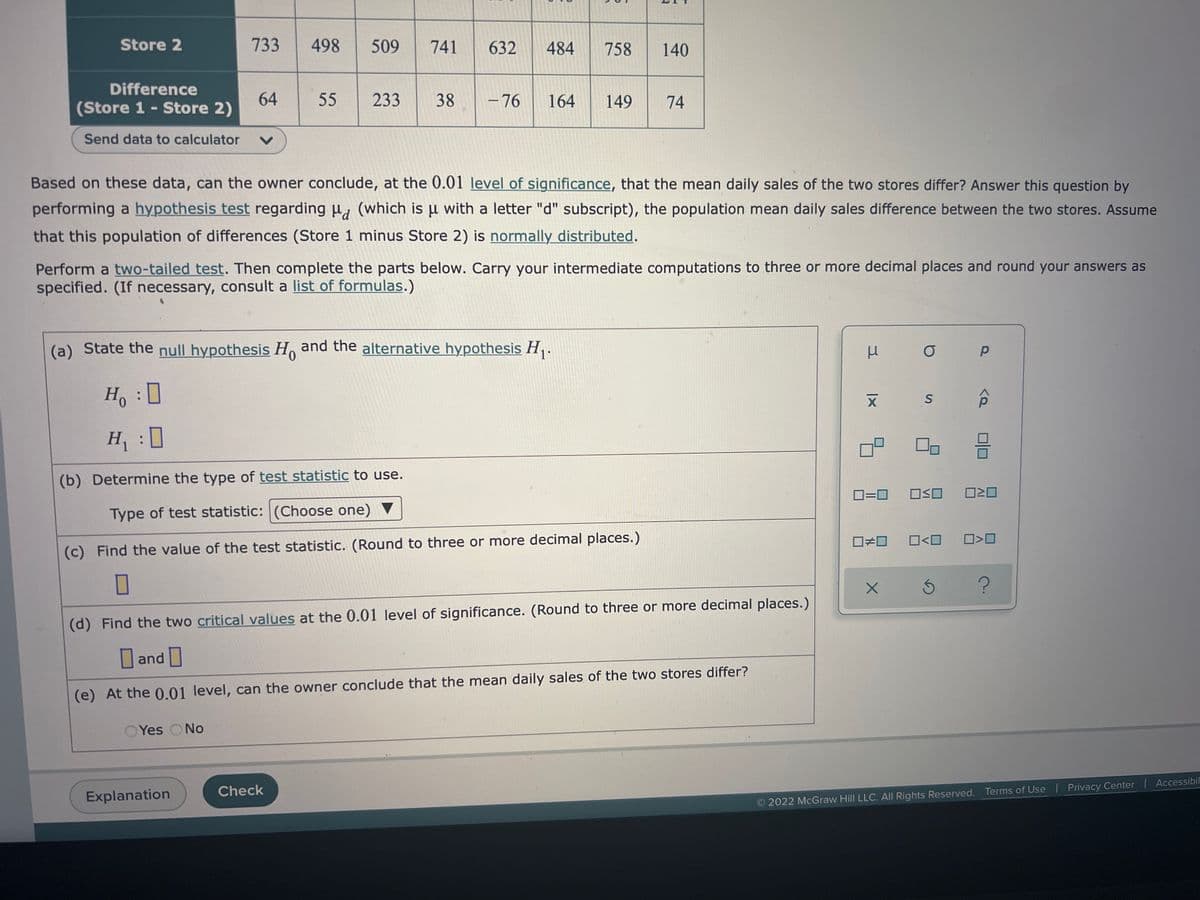
Transcribed Image Text:Store 2
733 498 509
741 632 484 758 140
Difference
64
55
(Store 1 - Store 2)
233 38 -76 164
149 74
Send data to calculator V
Based on these data, can the owner conclude, at the 0.01 level of significance, that the mean daily sales of the two stores differ? Answer this question by
performing a hypothesis test regarding μ (which is u with a letter "d" subscript), the population mean daily sales difference between the two stores. Assume
that this population of differences (Store 1 minus Store 2) is normally distributed.
Perform a two-tailed test. Then complete the parts below. Carry your intermediate computations to three or more decimal places and round your answers as
specified. (If necessary, consult a list of formulas.)
(a) State the null hypothesis H and the alternative hypothesis H₁.
O
Р
0
S
H₁ :0
믐
(b) Determine the type of test statistic to use.
0=0 OSO 020
Type of test statistic: (Choose one)
(c) Find the value of the test statistic. (Round to three or more decimal places.)
□□
0<0 ☐>0
0
X
Ś ?
(d) Find the two critical values at the 0.01 level of significance. (Round to three or more decimal places.)
and
(e) At the 0.01 level, can the owner conclude that the mean daily sales of the two stores differ?
Yes No
Explanation
Check
2022 McGraw Hill LLC. All Rights Reserved. Terms of Use | Privacy Center | Accessibil
3
XI
<Q
Transcribed Image Text:Espanol
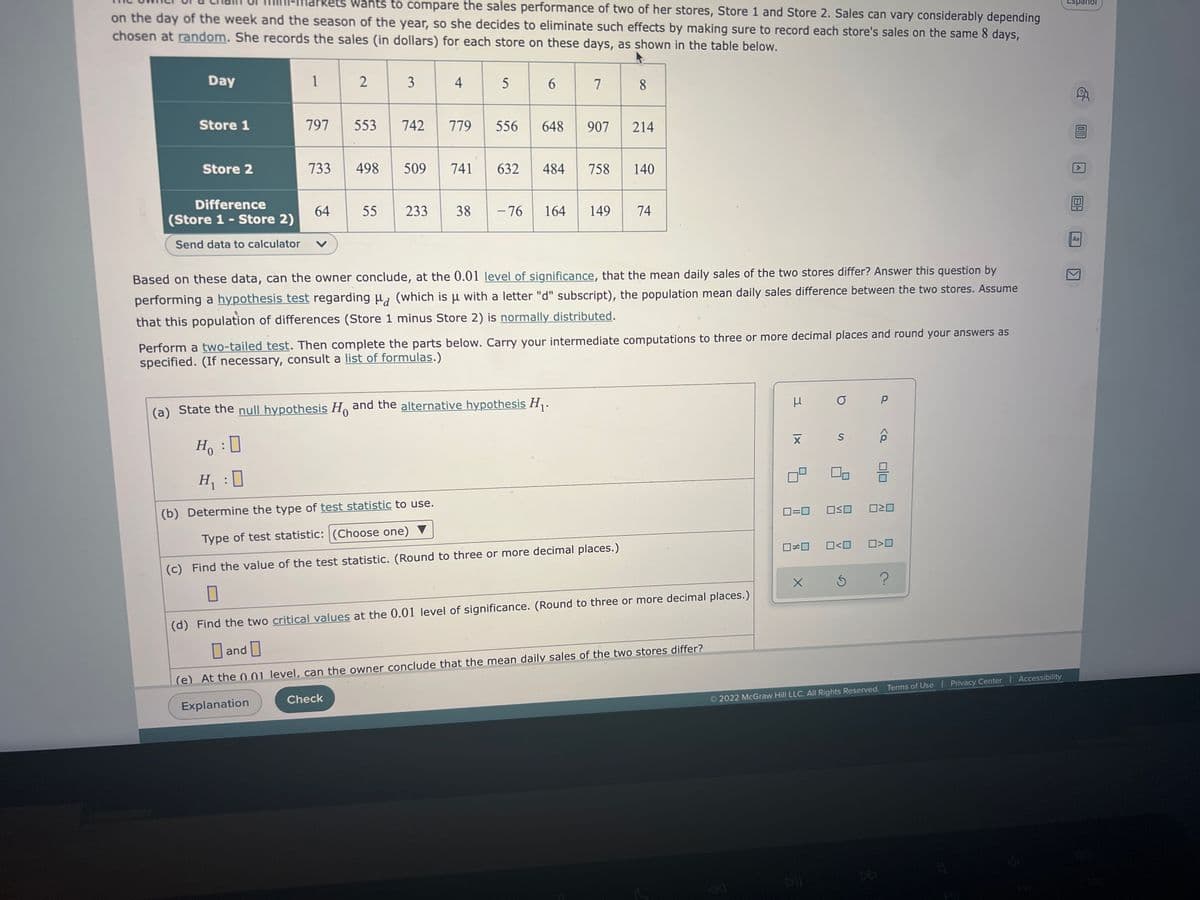
ets wants to compare the sales performance of two of her stores, Store 1 and Store 2. Sales can vary considerably depending
on the day of the week and the season of the year, so she decides to eliminate such effects by making sure to record each store's sales on the same 8 days,
chosen at random. She records the sales (in dollars) for each store on these days, as shown in the table below.
Day
1
2
3
4
5
6
7
8
Store 1
797 553
742
779
556
648 907 214
Store 2
733 498 509
741
632
484 758 140
Difference
64
55
233 38
-76
164 149 74
(Store 1-Store 2)
Send data to calculator V
Based on these data, can the owner conclude, at the 0.01 level of significance, that the mean daily sales of the two stores differ? Answer this question by
performing a hypothesis test regarding μ (which is μ with a letter "d" subscript), the population mean daily sales difference between the two stores. Assume
that this population of differences (Store 1 minus Store 2) is normally distributed.
Perform a two-tailed test. Then complete the parts below. Carry your intermediate computations to three or more decimal places and round your answers as
specified. (If necessary, consult a list of formulas.)
Р
(a) State the null hypothesis Ho and the alternative hypothesis H₁.
X
S
H₁ :0
H₁ :0
(b) Determine the type of test statistic to use.
0=0
OSO
020
Type of test statistic: (Choose one)
0#0
0<0 0>0
(c) Find the value of the test statistic. (Round to three or more decimal places.)
X
Ś ?
0
(d) Find the two critical values at the 0.01 level of significance. (Round to three or more decimal places.)
and
(e) At the 001 level, can the owner conclude that the mean daily sales of the two stores differ?
Check
2022 McGraw Hill LLC. All Rights Reserved. Terms of Use | Privacy Center | Accessibility
Explanation
5
3
|x
a
<Q
0
Aa
▶I
Expert Solution
This question has been solved!
Explore an expertly crafted, step-by-step solution for a thorough understanding of key concepts.

Step by step
Solved in 6 steps with 2 images

Recommended textbooks for you
MATLAB: An Introduction with Applications
Statistics
ISBN:
9781119256830
Author:
Amos Gilat
Publisher:
John Wiley & Sons Inc

Probability and Statistics for Engineering and th…
Statistics
ISBN:
9781305251809
Author:
Jay L. Devore
Publisher:
Cengage Learning

Statistics for The Behavioral Sciences (MindTap C…
Statistics
ISBN:
9781305504912
Author:
Frederick J Gravetter, Larry B. Wallnau
Publisher:
Cengage Learning
MATLAB: An Introduction with Applications
Statistics
ISBN:
9781119256830
Author:
Amos Gilat
Publisher:
John Wiley & Sons Inc
Probability and Statistics for Engineering and th…
Statistics
ISBN:
9781305251809
Author:
Jay L. Devore
Publisher:
Cengage Learning
Statistics for The Behavioral Sciences (MindTap C…
Statistics
ISBN:
9781305504912
Author:
Frederick J Gravetter, Larry B. Wallnau
Publisher:
Cengage Learning

Elementary Statistics: Picturing the World (7th E…
Statistics
ISBN:
9780134683416
Author:
Ron Larson, Betsy Farber
Publisher:
PEARSON

The Basic Practice of Statistics
Statistics
ISBN:
9781319042578
Author:
David S. Moore, William I. Notz, Michael A. Fligner
Publisher:
W. H. Freeman

Introduction to the Practice of Statistics
Statistics
ISBN:
9781319013387
Author:
David S. Moore, George P. McCabe, Bruce A. Craig
Publisher:
W. H. Freeman