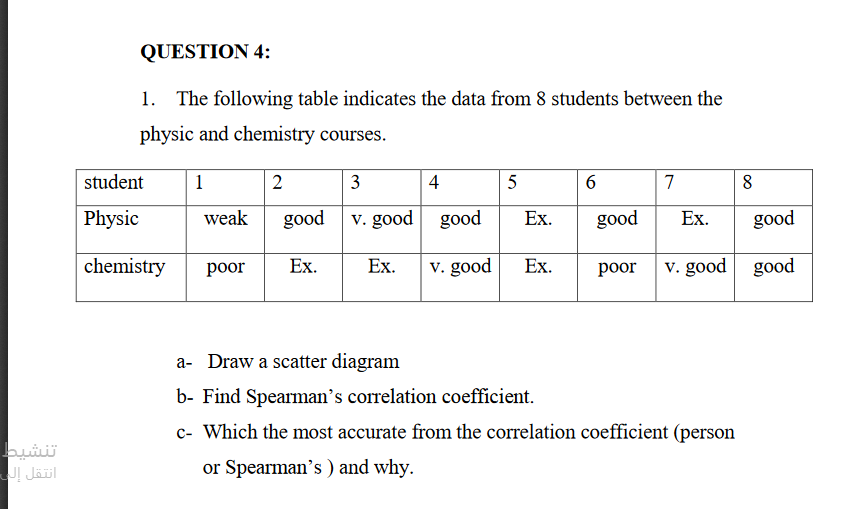
student 1 2 3 4 5 7 8 Physic weak good v. good good Ex. good Ex. good chemistry poor Ex. Ex. v. good Ex. poor v. good good a- Draw a scatter diagram b- Find Spearman’s correlation coefficient. c- Which the most accurate from the correlation coefficient (person or Spearman's ) and why.


Correlation
Correlation defines a relationship between two independent variables. It tells the degree to which variables move in relation to each other. When two sets of data are related to each other, there is a correlation between them.
Linear Correlation
A correlation is used to determine the relationships between numerical and categorical variables. In other words, it is an indicator of how things are connected to one another. The correlation analysis is the study of how variables are related.
Regression Analysis
Regression analysis is a statistical method in which it estimates the relationship between a dependent variable and one or more independent variable. In simple terms dependent variable is called as outcome variable and independent variable is called as predictors. Regression analysis is one of the methods to find the trends in data. The independent variable used in Regression analysis is named Predictor variable. It offers data of an associated dependent variable regarding a particular outcome.
The given data is in the form of five point Likert scale ( ordered categorical variable). we can code the categories as
Excellent-> 1
very good -> 2
good -> 3
weak -> 4
poor -> 5
After coding the variables take the values as
| S.No | 1 | 2 | 3 | 4 | 5 | 6 | 7 | 8 |
| Physics | 4 | 3 | 2 | 3 | 1 | 3 | 1 | 3 |
| Chemistry | 5 | 1 | 1 | 2 | 1 | 5 | 2 | 3 |
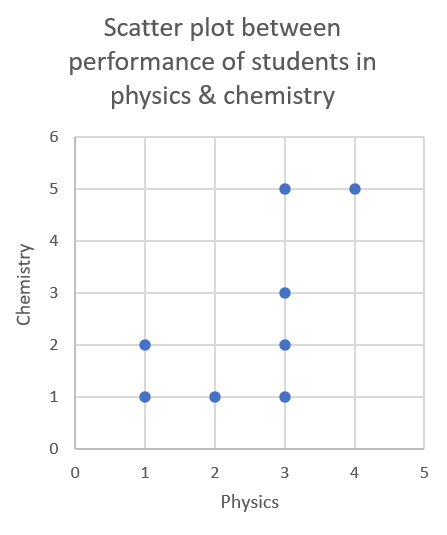
Part a: To make a scatter plot, following steps can be followed:
1. Make first quadrant of the Cartesian plane or x-y plane.
2. Mark an appropriate scale for physics on the x-axis.
3. Mark an appropriate scale for Chemistry on y-axis.
4. Mark the bi-variate points (x,y) on plane, for each of the 8 students.
we get the scatter plot as:
Part b: Here we have the case of repeated ranks. So common ranks will be given to the repeated ranks, where common ranks are the mean of the ranks which the students have taken if they are different.
Calculation table is:
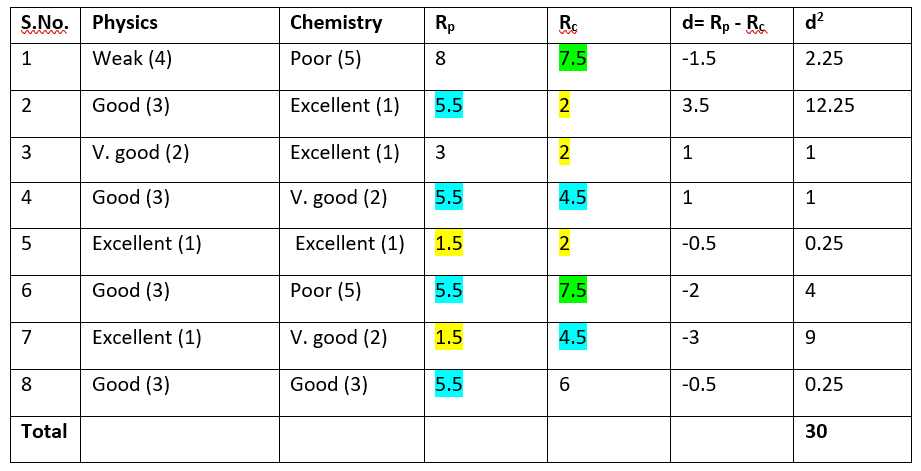
Here, we see repetitions of ranks 5 times: In physics rank 1.5 repeats 2 times and rank 5.5 repeats 4 times. And in Chemistry rank 2 repeats 3 three times, rank 4.5 repeats 2 times and rank 7.5 repeats 2 times.
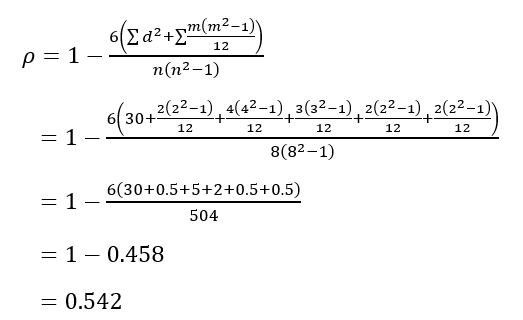
where, m is the number of times each repeated rank occurs.

Step by step
Solved in 3 steps with 3 images


