Sulled in öne sample of offspring that consisted of 447 green peas and 165 yellow peas. a. Construct a 95% confidence interval to estimate of the percentage of yellow peas. b. It was expected that 25% of the offspring peas would be yellow. Given that the percentage of offspring yellow peas from the sample is not 25%, do the results contradict expectations? a. Construct a 95% confidence interval. Express the percentages in decimal form.
Sulled in öne sample of offspring that consisted of 447 green peas and 165 yellow peas. a. Construct a 95% confidence interval to estimate of the percentage of yellow peas. b. It was expected that 25% of the offspring peas would be yellow. Given that the percentage of offspring yellow peas from the sample is not 25%, do the results contradict expectations? a. Construct a 95% confidence interval. Express the percentages in decimal form.

Glencoe Algebra 1, Student Edition, 9780079039897, 0079039898, 2018
18th Edition
ISBN:9780079039897
Author:Carter
Publisher:Carter
Chapter4: Equations Of Linear Functions
Section: Chapter Questions
Problem 8SGR

Related questions
Question
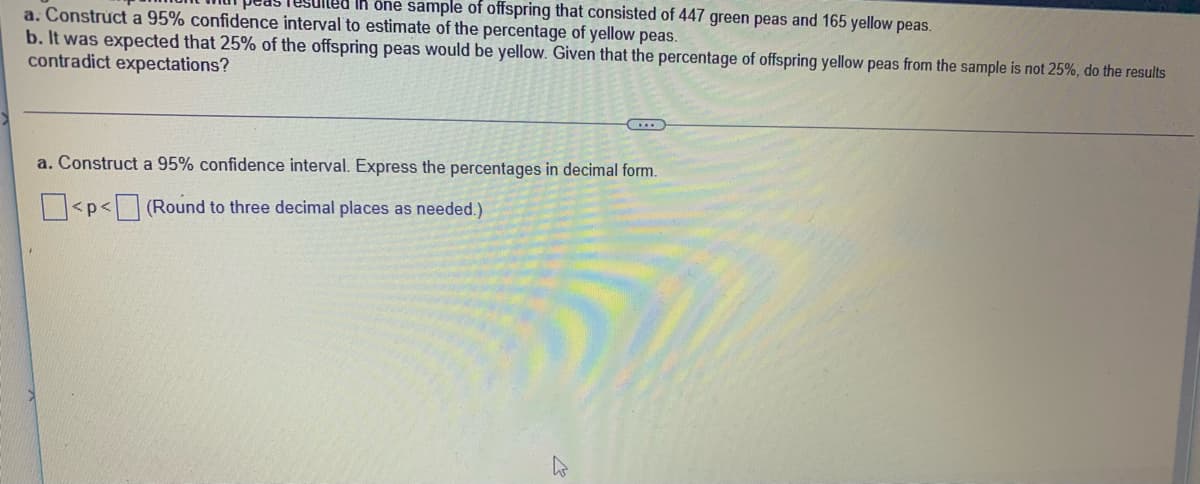
Transcribed Image Text:uled in ône sample of offspring that consisted of 447 green peas and 165 yellow peas.
a. Construct a 95% confidence interval to estimate of the percentage of yellow peas.
b. It was expected that 25% of the offspring peas would be yellow. Given that the percentage of offspring yellow peas from the sample is not 25%, do the results
contradict expectations?
a. Construct a 95% confidence interval. Express the percentages in decimal form.
<p< (Round to three decimal places as needed.)
Expert Solution
This question has been solved!
Explore an expertly crafted, step-by-step solution for a thorough understanding of key concepts.

Step by step
Solved in 2 steps with 1 images

Recommended textbooks for you
Glencoe Algebra 1, Student Edition, 9780079039897…
Algebra
ISBN:
9780079039897
Author:
Carter
Publisher:
McGraw Hill

College Algebra (MindTap Course List)
Algebra
ISBN:
9781305652231
Author:
R. David Gustafson, Jeff Hughes
Publisher:
Cengage Learning
Glencoe Algebra 1, Student Edition, 9780079039897…
Algebra
ISBN:
9780079039897
Author:
Carter
Publisher:
McGraw Hill
College Algebra (MindTap Course List)
Algebra
ISBN:
9781305652231
Author:
R. David Gustafson, Jeff Hughes
Publisher:
Cengage Learning