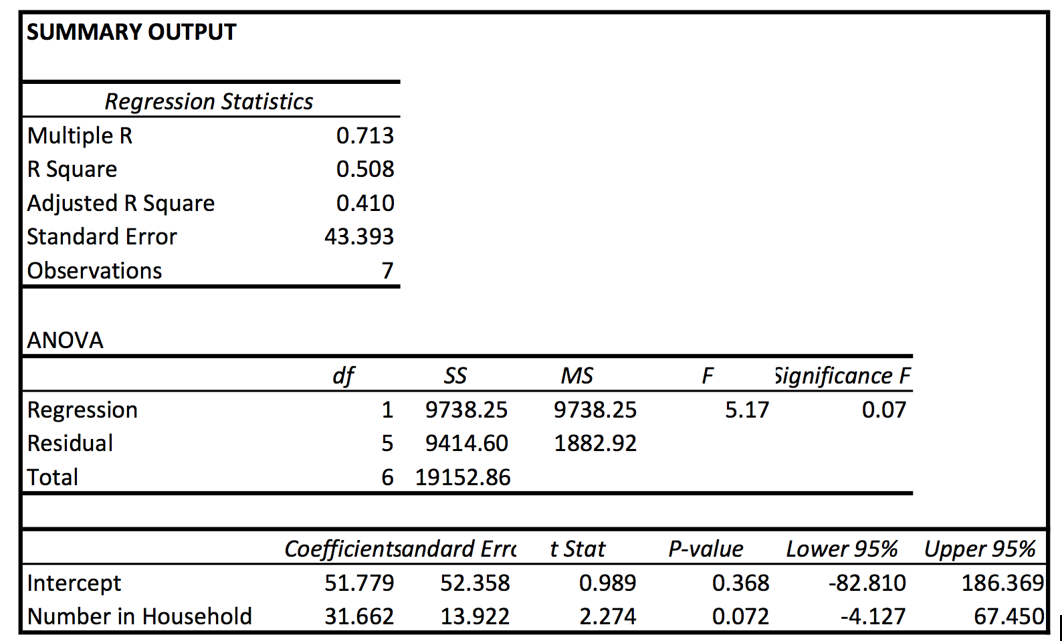
SUMMARY OUTPUT Regression Statistics Multiple R R Square Adjusted R Square Standard Error 0.713 0.508 0.410 43.393 Observations 7 ANOVA df SS MS Significance F Regression 1 9738.25 9738.25 5.17 0.07 Residual 9414.60 1882.92 Total 6 19152.86 Coefficientsandard Err P-value Lower 95% Upper 95% 186.369 t Stat Intercept 51.779 52.358 0.989 0.368 -82.810 Number in Household 31.662 13.922 2.274 0.072 -4.127 67.450


The following data was collected by a particular company to determine if a relationship between the number of people in a household and weekly food expenditures exists.
|
Household |
Number in Household |
Weekly Food Expenses |
|
1 |
2 |
$95 |
|
2 |
3 |
$137 |
|
3 |
5 |
$165 |
|
4 |
2 |
$105 |
|
5 |
4 |
$227 |
|
6 |
4 |
$240 |
|
7 |
5 |
$185 |
a. Using the least-squares regression line (from the excel output the regression equation is y=51.779 + 31.662x) , estimate the weekly food expenses for a household that has 10 people.
b. Briefly describe any concerns that you may have with your forecast or extrapolation in question above.
c. Give examples of two variables that should be included in the model above, explaining why these would make the model a better fit.


Trending now
This is a popular solution!

Step by step
Solved in 4 steps


