Suppose a simple random sample of size n 1000 is obtained from a population whose size is N 1,500.000 and whose population proportion with a specified characteristic is p -0.23. Complete parts (a) hroug Click here to view the standard normal distribution table (page 1). Click here to view the standard normal distribution table (pege 2). (a) Describe the sampling distribution of p. OA. Approximately normal, =0.23 and a0.0133 OB. Approximately normal, 0.23 and as0.0003 OC. Approximately normal, p0.23 and a0.0002 (b) What is the probability of obtaining x= 250 or more individuals with the characteristic? P(x2 250) =(Round to four decimal places as needed.) (c) What is the probability of obtaining x 190 or fewer individuals with the characteristic? P(xs 190) =(Round to four decimal places as needed.)
Suppose a simple random sample of size n 1000 is obtained from a population whose size is N 1,500.000 and whose population proportion with a specified characteristic is p -0.23. Complete parts (a) hroug Click here to view the standard normal distribution table (page 1). Click here to view the standard normal distribution table (pege 2). (a) Describe the sampling distribution of p. OA. Approximately normal, =0.23 and a0.0133 OB. Approximately normal, 0.23 and as0.0003 OC. Approximately normal, p0.23 and a0.0002 (b) What is the probability of obtaining x= 250 or more individuals with the characteristic? P(x2 250) =(Round to four decimal places as needed.) (c) What is the probability of obtaining x 190 or fewer individuals with the characteristic? P(xs 190) =(Round to four decimal places as needed.)

MATLAB: An Introduction with Applications
6th Edition
ISBN:9781119256830
Author:Amos Gilat
Publisher:Amos Gilat
Chapter1: Starting With Matlab
Section: Chapter Questions
Problem 1P

Related questions
Question
Help 13
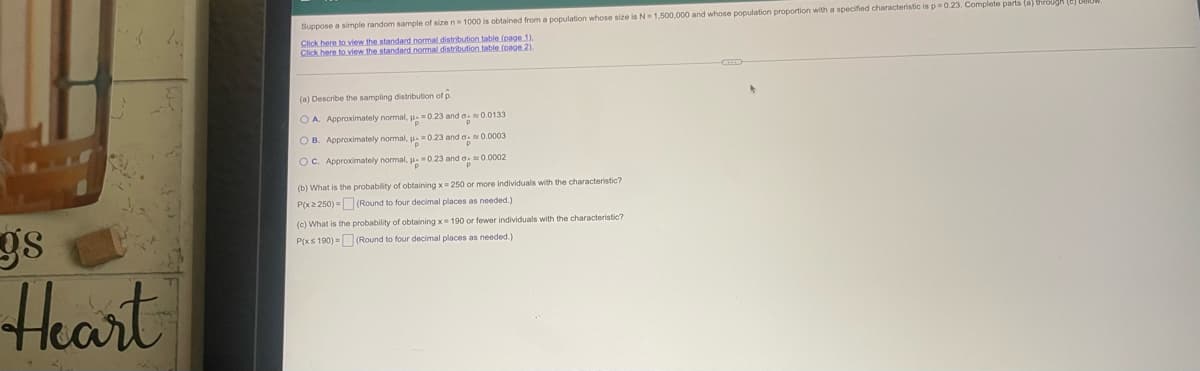
Transcribed Image Text:Suppose a simple random sample of sizen 1000 is obtained from a population whose size is N= 1,500.000 and whose population proportion with a specified characteristic is p0.23. Complete parts (a) through
Click here to view the standard normal distribution table (page 1).
Click here to view.the standard nomal distribution table (page 2).
(a) Describe the sampling distribution of p.
O A. Approximately normal, = 0.23 and o0.0133
O B. Approximately normal, 0.23 and o0.0003
OC. Approximately normal, u0.23 and a.0.0002
(b) What is the probability of obtaining x= 250 or more individuals with the characteristic?
P(x2 250) = (Round to four decimal places as needed.)
(c) What is the probability of obtaining x= 190 or fewer individuals with the characteristic?
P(xs 190) = (Round to four decimal places as needed.)
Heart
Expert Solution
This question has been solved!
Explore an expertly crafted, step-by-step solution for a thorough understanding of key concepts.

This is a popular solution!

Trending now
This is a popular solution!

Step by step
Solved in 2 steps with 1 images

Recommended textbooks for you
MATLAB: An Introduction with Applications
Statistics
ISBN:
9781119256830
Author:
Amos Gilat
Publisher:
John Wiley & Sons Inc

Probability and Statistics for Engineering and th…
Statistics
ISBN:
9781305251809
Author:
Jay L. Devore
Publisher:
Cengage Learning

Statistics for The Behavioral Sciences (MindTap C…
Statistics
ISBN:
9781305504912
Author:
Frederick J Gravetter, Larry B. Wallnau
Publisher:
Cengage Learning
MATLAB: An Introduction with Applications
Statistics
ISBN:
9781119256830
Author:
Amos Gilat
Publisher:
John Wiley & Sons Inc
Probability and Statistics for Engineering and th…
Statistics
ISBN:
9781305251809
Author:
Jay L. Devore
Publisher:
Cengage Learning
Statistics for The Behavioral Sciences (MindTap C…
Statistics
ISBN:
9781305504912
Author:
Frederick J Gravetter, Larry B. Wallnau
Publisher:
Cengage Learning

Elementary Statistics: Picturing the World (7th E…
Statistics
ISBN:
9780134683416
Author:
Ron Larson, Betsy Farber
Publisher:
PEARSON

The Basic Practice of Statistics
Statistics
ISBN:
9781319042578
Author:
David S. Moore, William I. Notz, Michael A. Fligner
Publisher:
W. H. Freeman

Introduction to the Practice of Statistics
Statistics
ISBN:
9781319013387
Author:
David S. Moore, George P. McCabe, Bruce A. Craig
Publisher:
W. H. Freeman