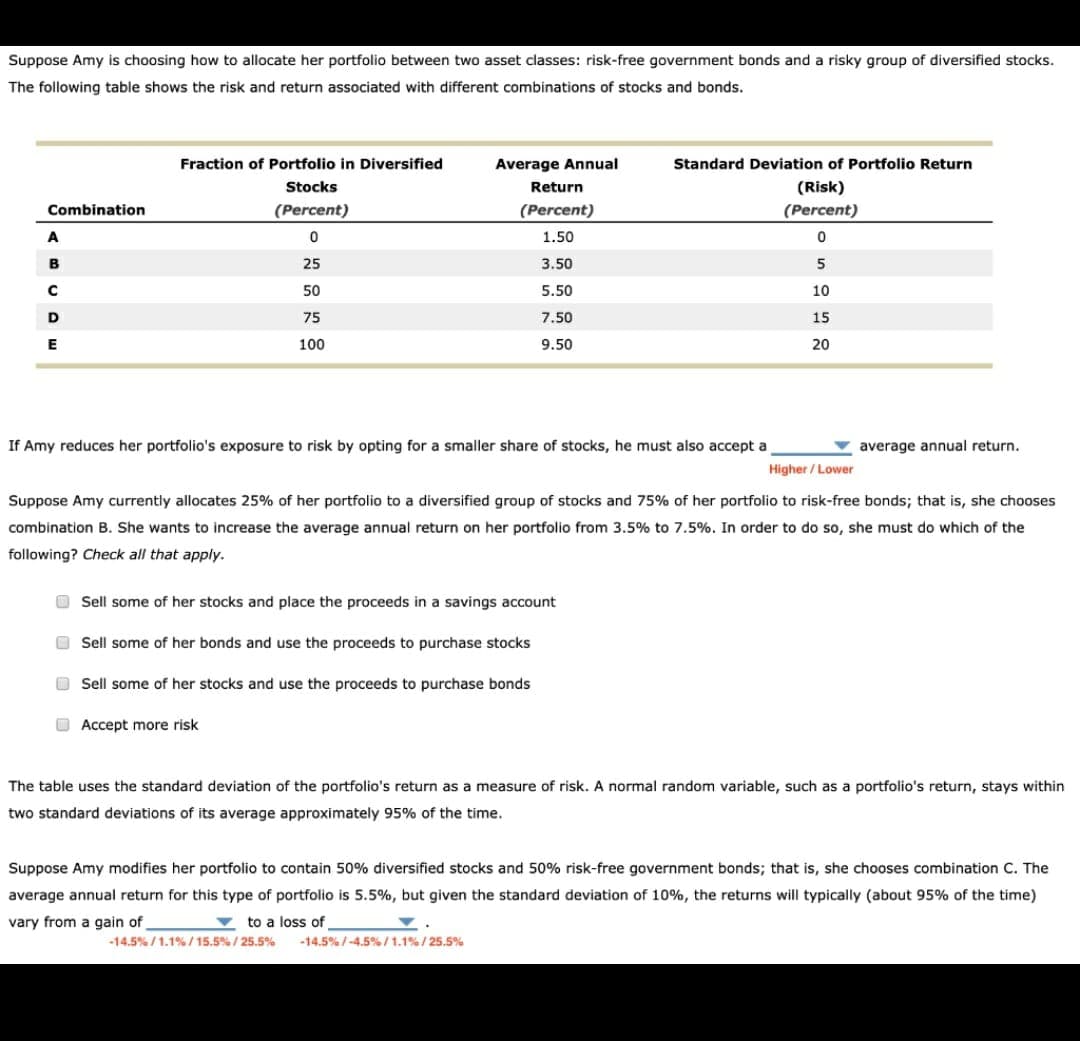
Suppose Amy is choosing how to allocate her portfolio between two asset classes: risk-free government bonds and a risky group of diversified stocks. The following table shows the risk and return associated with different combinations of stocks and bonds. Fraction of Portfolio in Diversified Average Annual Return Standard Deviation of Portfolio Return (Risk) Stocks (Percent) Combination (Percent) (Percent) A 0 1.50 0 B 25 3.50 5 C 50 5.50 10 D 75 7.50 15 100 9.50 20 If Amy reduces her portfolio's exposure to risk by opting for a smaller share of stocks, he must also accept a average annual return. Higher/Lower Suppose Amy currently allocates 25% of her portfolio to a diversified group of stocks and 75% of her portfolio to risk-free bonds; that is, she chooses combination B. She wants to increase the average annual return on her portfolio from 3.5% to 7.5%. In order to do so, she must do which of the following? Check all that apply. Sell some of her stocks and place the proceeds in a savings account Sell some of her bonds and use the proceeds to purchase stocks Sell some of her stocks and use the proceeds to purchase bonds Accept more risk The table uses the standard deviation of the portfolio's return as a measure of risk. A normal random variable, such as a portfolio's return, stays within two standard deviations of its average approximately 95% of the time. Suppose Amy modifies her portfolio to contain 50% diversified stocks and 50% risk-free government bonds; that is, she chooses combination C. The average annual return for this type of portfolio is 5.5%, but given the standard deviation of 10%, the returns will typically (about 95% of the time) vary from a gain of to a loss of -14.5 % / 1.1% / 15.5% / 25.5% -14.5 % / -4.5 % / 1.1% /25.5%
Suppose Amy is choosing how to allocate her portfolio between two asset classes: risk-free government bonds and a risky group of diversified stocks. The following table shows the risk and return associated with different combinations of stocks and bonds. Fraction of Portfolio in Diversified Average Annual Return Standard Deviation of Portfolio Return (Risk) Stocks (Percent) Combination (Percent) (Percent) A 0 1.50 0 B 25 3.50 5 C 50 5.50 10 D 75 7.50 15 100 9.50 20 If Amy reduces her portfolio's exposure to risk by opting for a smaller share of stocks, he must also accept a average annual return. Higher/Lower Suppose Amy currently allocates 25% of her portfolio to a diversified group of stocks and 75% of her portfolio to risk-free bonds; that is, she chooses combination B. She wants to increase the average annual return on her portfolio from 3.5% to 7.5%. In order to do so, she must do which of the following? Check all that apply. Sell some of her stocks and place the proceeds in a savings account Sell some of her bonds and use the proceeds to purchase stocks Sell some of her stocks and use the proceeds to purchase bonds Accept more risk The table uses the standard deviation of the portfolio's return as a measure of risk. A normal random variable, such as a portfolio's return, stays within two standard deviations of its average approximately 95% of the time. Suppose Amy modifies her portfolio to contain 50% diversified stocks and 50% risk-free government bonds; that is, she chooses combination C. The average annual return for this type of portfolio is 5.5%, but given the standard deviation of 10%, the returns will typically (about 95% of the time) vary from a gain of to a loss of -14.5 % / 1.1% / 15.5% / 25.5% -14.5 % / -4.5 % / 1.1% /25.5%

Brief Principles of Macroeconomics (MindTap Course List)
8th Edition
ISBN:9781337091985
Author:N. Gregory Mankiw
Publisher:N. Gregory Mankiw
Chapter9: The Basic Tools Of Finance
Section: Chapter Questions
Problem 9PA

Related questions
Question
Transcribed Image Text:Suppose Amy is choosing how to allocate her portfolio between two asset classes: risk-free government bonds and a risky group of diversified stocks.
The following table shows the risk and return associated with different combinations of stocks and bonds.
Fraction of Portfolio in Diversified
Standard Deviation of Portfolio Return
Average Annual
Return
Stocks
(Risk)
(Percent)
Combination
(Percent)
(Percent)
A
0
1.50
0
B
25
3.50
5
с
50
5.50
10
D
75
7.50
15
E
100
9.50
20
If Amy reduces her portfolio's exposure to risk by opting for a smaller share of stocks, he must also accept a
average annual return.
Higher/Lower
Suppose Amy currently allocates 25% of her portfolio to a diversified group of stocks and 75% of her portfolio to risk-free bonds; that is, she chooses
combination B. She wants to increase the average annual return on her portfolio from 3.5% to 7.5%. In order to do so, she must do which of the
following? Check all that apply.
Sell some of her stocks and place the proceeds in a savings account
Sell some of her bonds and use the proceeds to purchase stocks
Sell some of her stocks and use the proceeds to purchase bonds
Accept more risk
The table uses the standard deviation of the portfolio's return as a measure of risk. A normal random variable, such as a portfolio's return, stays within
two standard deviations of its average approximately 95% of the time.
Suppose Amy modifies her portfolio to contain 50% diversified stocks and 50% risk-free government bonds; that is, she chooses combination C. The
average annual return for this type of portfolio is 5.5%, but given the standard deviation of 10%, the returns will typically (about 95% of the time)
vary from a gain of
to a loss of
Y.
-14.5 % / 1.1% / 15.5 % / 25.5% -14.5%/-4.5 % / 1.1% / 25.5%
Expert Solution
This question has been solved!
Explore an expertly crafted, step-by-step solution for a thorough understanding of key concepts.

This is a popular solution!

Trending now
This is a popular solution!

Step by step
Solved in 2 steps

Knowledge Booster


Learn more about
Need a deep-dive on the concept behind this application? Look no further. Learn more about this topic, economics and related others by exploring similar questions and additional content below.Recommended textbooks for you
Brief Principles of Macroeconomics (MindTap Cours…
Economics
ISBN:
9781337091985
Author:
N. Gregory Mankiw
Publisher:
Cengage Learning

Essentials of Economics (MindTap Course List)
Economics
ISBN:
9781337091992
Author:
N. Gregory Mankiw
Publisher:
Cengage Learning

Microeconomics: Principles & Policy
Economics
ISBN:
9781337794992
Author:
William J. Baumol, Alan S. Blinder, John L. Solow
Publisher:
Cengage Learning
Brief Principles of Macroeconomics (MindTap Cours…
Economics
ISBN:
9781337091985
Author:
N. Gregory Mankiw
Publisher:
Cengage Learning
Essentials of Economics (MindTap Course List)
Economics
ISBN:
9781337091992
Author:
N. Gregory Mankiw
Publisher:
Cengage Learning
Microeconomics: Principles & Policy
Economics
ISBN:
9781337794992
Author:
William J. Baumol, Alan S. Blinder, John L. Solow
Publisher:
Cengage Learning


Principles of Macroeconomics (MindTap Course List)
Economics
ISBN:
9781285165912
Author:
N. Gregory Mankiw
Publisher:
Cengage Learning

Principles of Economics, 7th Edition (MindTap Cou…
Economics
ISBN:
9781285165875
Author:
N. Gregory Mankiw
Publisher:
Cengage Learning