Given are five observations for two variables, x and y. xi 5 13 7 21 19 yi 59 42 55 10 29 -select your answer- choices: a. (A, B, C, D) the different graphs are being attached b. What does the scatter diagram developed in part (a) indicate about the relationship between the two variables? There appears to be a (positive, negative) linear relationship between x and y. c. Try to approximate the relationship between x and y by drawing a straight line through the data. (Many different straight lines can be drawn, Only one straight line can be drawn, A straight line cannot be drawn) to provide a linear approximation of the relationship between x and y.
Given are five observations for two variables, x and y. xi 5 13 7 21 19 yi 59 42 55 10 29 -select your answer- choices: a. (A, B, C, D) the different graphs are being attached b. What does the scatter diagram developed in part (a) indicate about the relationship between the two variables? There appears to be a (positive, negative) linear relationship between x and y. c. Try to approximate the relationship between x and y by drawing a straight line through the data. (Many different straight lines can be drawn, Only one straight line can be drawn, A straight line cannot be drawn) to provide a linear approximation of the relationship between x and y.

Glencoe Algebra 1, Student Edition, 9780079039897, 0079039898, 2018
18th Edition
ISBN:9780079039897
Author:Carter
Publisher:Carter
Chapter10: Statistics
Section10.2: Representing Data
Problem 24PFA

Related questions
Question
100%
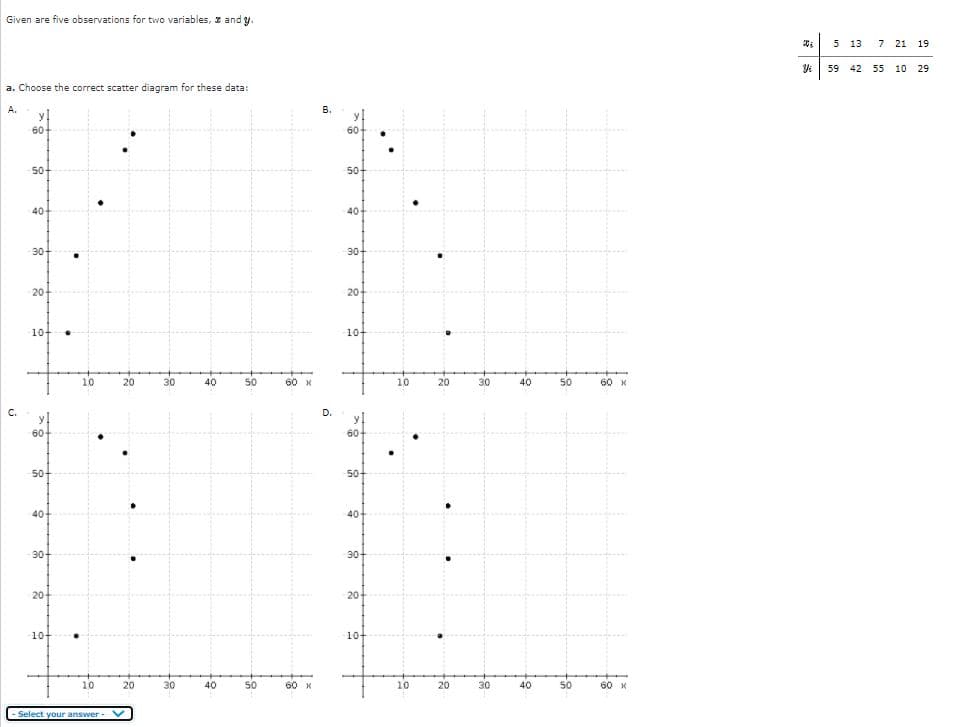
Given are five observations for two variables, x and y.
| xi | 5 | 13 | 7 | 21 | 19 |
| yi | 59 | 42 | 55 | 10 | 29 |
-select your answer- choices:
a. (A, B, C, D) the different graphs are being attached
b. What does the
There appears to be a (positive, negative) linear relationship between x and y.
c. Try to approximate the relationship between x and y by drawing a straight line through the data.
(Many different straight lines can be drawn, Only one straight line can be drawn, A straight line cannot be drawn) to provide a linear approximation of the relationship between x and y.
D & E questions are being attached.
Thank you!
Transcribed Image Text:Given are five observations for two variables, z and y.
5 13
7 21 19
59 42 55 10 29
a. Choose the correct scatter diagram for these data:
A.
y!
60
В.
60
50-
50
40-
40
30-
30-
20
20
10+
10+
10
20
30
40
50
60 x
10
20
30
40
50
60 X
C.
D.
60-
60
50-
50-
40
40-
30
30-
20-
20
10-
10
10
20
30
40
50
60 x
10
20
30
40
50
60 к
Select your answer-
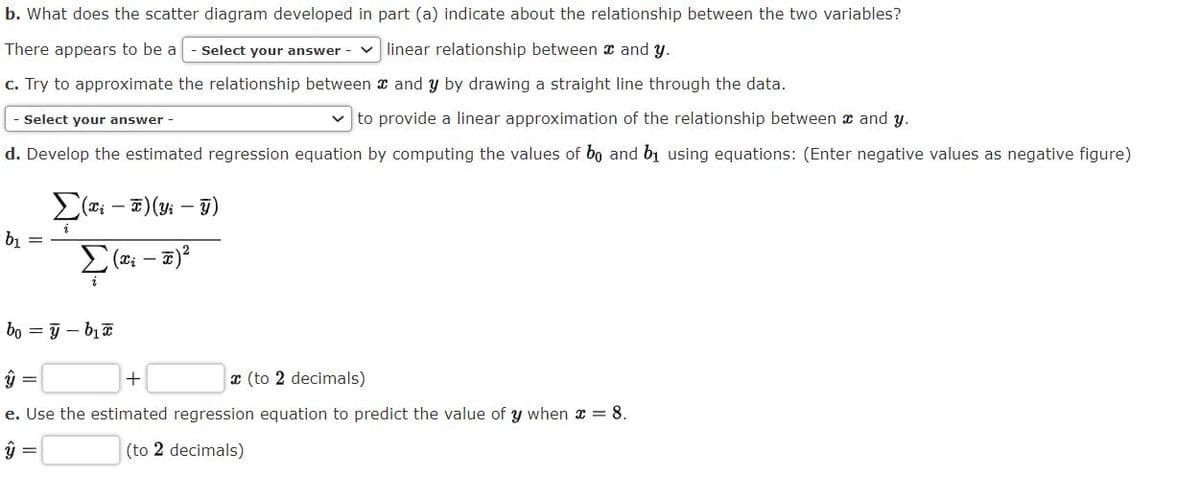
Transcribed Image Text:b. What does the scatter diagram developed in part (a) indicate about the relationship between the two variables?
There appears to be a
- Select your answer - v linear relationship between x and y.
c. Try to approximate the relationship between x and y by drawing a straight line through the data.
Select your answer -
v to provide a linear approximation of the relationship between x and y.
d. Develop the estimated regression equation by computing the values of bo and bị using equations: (Enter negative values as negative figure)
b1 =
bo = 9 - bịa
x (to 2 decimals)
e. Use the estimated regression equation to predict the value of y when x = 8.
ü =
(to 2 decimals)
Expert Solution
This question has been solved!
Explore an expertly crafted, step-by-step solution for a thorough understanding of key concepts.

This is a popular solution!

Trending now
This is a popular solution!

Step by step
Solved in 2 steps with 1 images

Recommended textbooks for you
Glencoe Algebra 1, Student Edition, 9780079039897…
Algebra
ISBN:
9780079039897
Author:
Carter
Publisher:
McGraw Hill

Functions and Change: A Modeling Approach to Coll…
Algebra
ISBN:
9781337111348
Author:
Bruce Crauder, Benny Evans, Alan Noell
Publisher:
Cengage Learning
Glencoe Algebra 1, Student Edition, 9780079039897…
Algebra
ISBN:
9780079039897
Author:
Carter
Publisher:
McGraw Hill
Functions and Change: A Modeling Approach to Coll…
Algebra
ISBN:
9781337111348
Author:
Bruce Crauder, Benny Evans, Alan Noell
Publisher:
Cengage Learning