Suppose Edison runs a small business that manufactures frying pans. Assume that the market for frying pans is a competitive market, and the market price is $20 per frying pan. The following graph shows Edison's total cost curve. Use the blue points (circle symbol) to plot total revenue and the green points (triangle symbol) to plot profit for frying pans quantities zero through seven (inclusive) that Edison produces. TOTAL COST AND REVENUE (Dotars) * 8 हृ 55 ४ 200 176 150 125 100 -25 2 n QUANTITY (Frying pans) B Total Cost Total Revenue A Profit Calculate Edison's marginal revenue and marginal cost for the first seven frying pans he produces, and plot them on the following graph. Use the blue points (circle symbol) to plot marginal revenue and the orange points (square symbol) to plot marginal cost at each quantity.
Suppose Edison runs a small business that manufactures frying pans. Assume that the market for frying pans is a competitive market, and the market price is $20 per frying pan. The following graph shows Edison's total cost curve. Use the blue points (circle symbol) to plot total revenue and the green points (triangle symbol) to plot profit for frying pans quantities zero through seven (inclusive) that Edison produces. TOTAL COST AND REVENUE (Dotars) * 8 हृ 55 ४ 200 176 150 125 100 -25 2 n QUANTITY (Frying pans) B Total Cost Total Revenue A Profit Calculate Edison's marginal revenue and marginal cost for the first seven frying pans he produces, and plot them on the following graph. Use the blue points (circle symbol) to plot marginal revenue and the orange points (square symbol) to plot marginal cost at each quantity.

Principles of Economics (MindTap Course List)
8th Edition
ISBN:9781305585126
Author:N. Gregory Mankiw
Publisher:N. Gregory Mankiw
Chapter14: Firms In Competitive Markets
Section: Chapter Questions
Problem 4PA

Related questions
Question
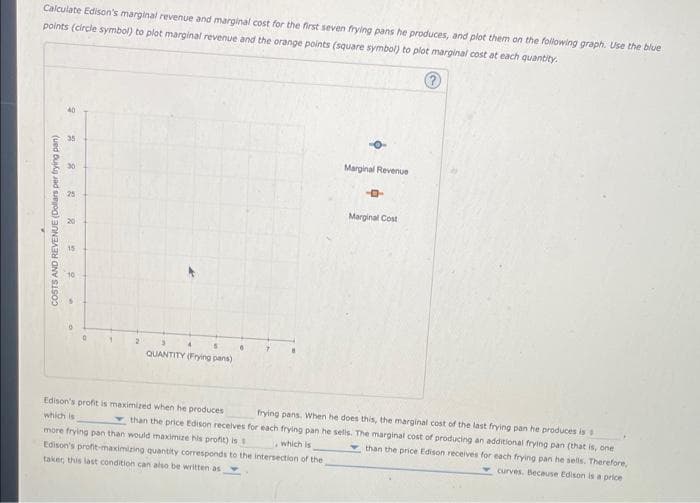
Transcribed Image Text:Calculate Edison's marginal revenue and marginal cost for the first seven frying pans he produces, and plot them on the following graph. Use the blue
points (circle symbol) to plot marginal revenue and the orange points (square symbol) to plot marginal cost at each quantity.
COSTS AND REVENUE (Dollars per frying pan)
O
35
30
25
20
15
10
1
2
QUANTITY (Frying pans)
Marginal Revenue
-4
Marginal Cost
Edison's profit is maximized when he produces
frying pans. When he does this, the marginal cost of the last frying pan he produces is s
which is
than the price Edison receives for each frying pan he sells. The marginal cost of producing an additional frying pan (that is, one
more frying pan than would maximize his profit) is
than the price Edison receives for each frying pan he sells. Therefore,
curves. Because Edison is a price
which is
Edison's profit-maximizing quantity corresponds to the intersection of the
taker, this last condition can also be written as
Transcribed Image Text:Is
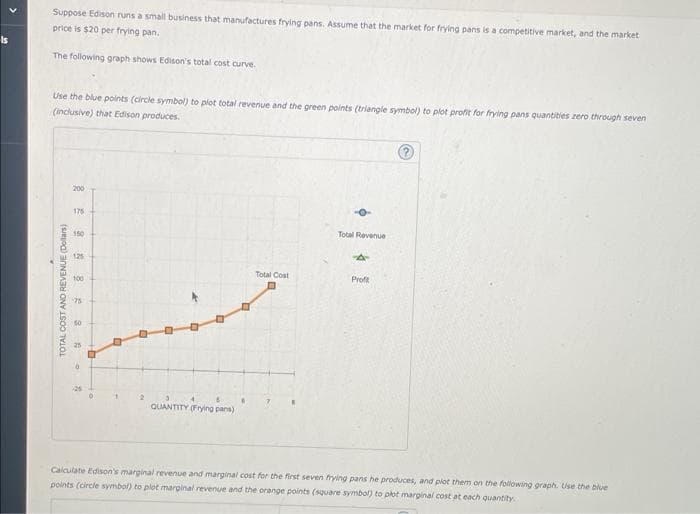
Suppose Edison runs a small business that manufactures frying pans. Assume that the market for frying pans is a competitive market, and the market
price is $20 per frying pan.
The following graph shows Edison's total cost curve.
Use the blue points (circle symbol) to plot total revenue and the green points (triangle symbol) to plot profit for frying pans quantities zero through seven
(inclusive) that Edison produces.
TOTAL COST AND REVENUE (Dolars)
200
175
150
125
100
50
0
-25
0
O
2
3
4
6
QUANTITY (Frying pans)
Total Cost
Total Revenue
A
Profit
?
Calculate Edison's marginal revenue and marginal cost for the first seven frying pans he produces, and plot them on the following graph. Use the blue
points (circle symbol) to plot marginal revenue and the orange points (square symbol) to plot marginal cost at each quantity.
Expert Solution
This question has been solved!
Explore an expertly crafted, step-by-step solution for a thorough understanding of key concepts.

This is a popular solution!

Trending now
This is a popular solution!

Step by step
Solved in 5 steps with 4 images

Knowledge Booster


Learn more about
Need a deep-dive on the concept behind this application? Look no further. Learn more about this topic, economics and related others by exploring similar questions and additional content below.Recommended textbooks for you
Principles of Economics (MindTap Course List)
Economics
ISBN:
9781305585126
Author:
N. Gregory Mankiw
Publisher:
Cengage Learning

Principles of Economics, 7th Edition (MindTap Cou…
Economics
ISBN:
9781285165875
Author:
N. Gregory Mankiw
Publisher:
Cengage Learning

Essentials of Economics (MindTap Course List)
Economics
ISBN:
9781337091992
Author:
N. Gregory Mankiw
Publisher:
Cengage Learning
Principles of Economics (MindTap Course List)
Economics
ISBN:
9781305585126
Author:
N. Gregory Mankiw
Publisher:
Cengage Learning
Principles of Economics, 7th Edition (MindTap Cou…
Economics
ISBN:
9781285165875
Author:
N. Gregory Mankiw
Publisher:
Cengage Learning
Essentials of Economics (MindTap Course List)
Economics
ISBN:
9781337091992
Author:
N. Gregory Mankiw
Publisher:
Cengage Learning

Principles of Microeconomics (MindTap Course List)
Economics
ISBN:
9781305971493
Author:
N. Gregory Mankiw
Publisher:
Cengage Learning

Principles of Microeconomics
Economics
ISBN:
9781305156050
Author:
N. Gregory Mankiw
Publisher:
Cengage Learning

Principles of Economics 2e
Economics
ISBN:
9781947172364
Author:
Steven A. Greenlaw; David Shapiro
Publisher:
OpenStax