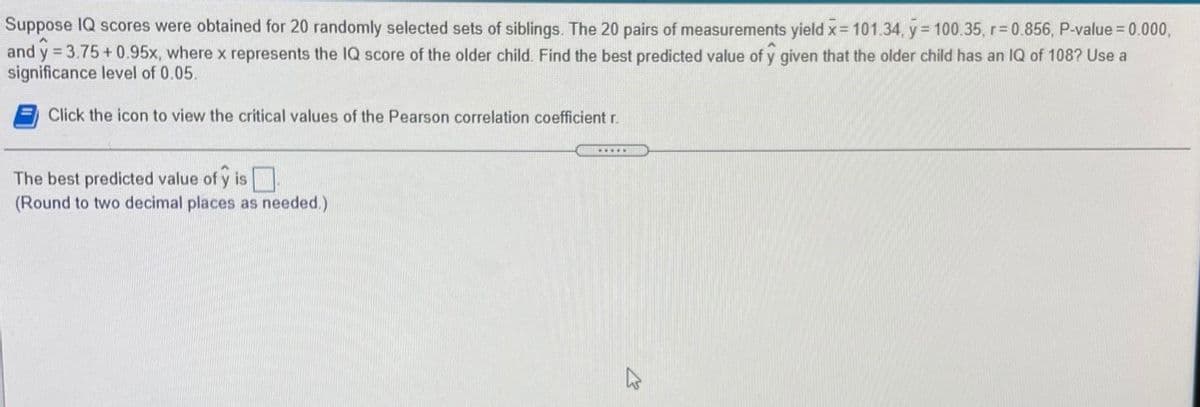
Suppose IQ scores were obtained for 20 randomly selected sets of siblings. The 20 pairs of measurements yield x 101.34, y 100.35, r 0.856, P-value = 0.000, and y = 3.75+0.95x, where x represents the IQ score of the older child. Find the best predicted value of y given that the older child has an IQ of 108? Use a significance level of 0.05. Click the icon to view the critical values of the Pearson correlation coefficient r. ...... The best predicted value of y is (Round to two decimal places as needed.)
Suppose IQ scores were obtained for 20 randomly selected sets of siblings. The 20 pairs of measurements yield x 101.34, y 100.35, r 0.856, P-value = 0.000, and y = 3.75+0.95x, where x represents the IQ score of the older child. Find the best predicted value of y given that the older child has an IQ of 108? Use a significance level of 0.05. Click the icon to view the critical values of the Pearson correlation coefficient r. ...... The best predicted value of y is (Round to two decimal places as needed.)

Glencoe Algebra 1, Student Edition, 9780079039897, 0079039898, 2018
18th Edition
ISBN:9780079039897
Author:Carter
Publisher:Carter
Chapter10: Statistics
Section10.6: Summarizing Categorical Data
Problem 23PPS

Related questions
Question
100%
Section 10.2
Question #4
Suppose IQ scores were obtained for 20randomly selected sets of siblings. The 20 pairs of measurements yield x=101.34, y=100.35,
r=0.856, P-value=0.000, and y=3.75+0.95x, where x represents the IQ score of the older child. Find the best predicted value of y
given that the older child has an IQ of 108? Use a significance level of 0.05.View the critical values of the Pearson correlation coefficient r.
Critical values of the pearson correlation coefficient r
|
n
|
α=0.05
|
α=0.01
|
NOTE: To test H0: ρ=0 against H1: ρ≠0, reject H0 if the absolute value of r is greater than the critical value in the table. |
|---|---|---|---|
|
4
|
0.950
|
0.990
|
|
|
5
|
0.878
|
0.959
|
|
|
6
|
0.811
|
0.917
|
|
|
7
|
0.754
|
0.875
|
|
|
8
|
0.707
|
0.834
|
|
|
9
|
0.666
|
0.798
|
|
|
10
|
0.632
|
0.765
|
|
|
11
|
0.602
|
0.735
|
|
|
12
|
0.576
|
0.708
|
|
|
13
|
0.553
|
0.684
|
|
|
14
|
0.532
|
0.661
|
|
|
15
|
0.514
|
0.641
|
|
|
16
|
0.497
|
0.623
|
|
|
17
|
0.482
|
0.606
|
|
|
18
|
0.468
|
0.590
|
|
|
19
|
0.456
|
0.575
|
|
|
20
|
0.444
|
0.561
|
|
|
25
|
0.396
|
0.505
|
|
|
30
|
0.361
|
0.463
|
|
|
35
|
0.335
|
0.430
|
|
|
40
|
0.312
|
0.402
|
|
|
45
|
0.294
|
0.378
|
|
|
50
|
0.279
|
0.361
|
|
|
60
|
0.254
|
0.330
|
|
|
70
|
0.236
|
0.305
|
|
|
80
|
0.220
|
0.286
|
|
|
90
|
0.207
|
0.269
|
|
|
100
|
0.196
|
0.256
|
|
|
n
|
α=0.05
|
α=0.01
|
The best predicted value of y is _________.
(Round to two decimal places as needed.)
Transcribed Image Text:Suppose IQ scores were obtained for 20 randomly selected sets of siblings. The 20 pairs of measurements yield x = 101.34, y 100.35, r 0.856, P-value 0.000,
and y = 3.75+0.95x, where x represents the IQ score of the older child. Find the best predicted value of y given that the older child has an IQ of 108? Use a
significance level of 0.05.
Click the icon to view the critical values of the Pearson correlation coefficient r.
w....
The best predicted value of y is
(Round to two decimal places as needed.)
Expert Solution
This question has been solved!
Explore an expertly crafted, step-by-step solution for a thorough understanding of key concepts.

This is a popular solution!

Trending now
This is a popular solution!

Step by step
Solved in 3 steps

Recommended textbooks for you
Glencoe Algebra 1, Student Edition, 9780079039897…
Algebra
ISBN:
9780079039897
Author:
Carter
Publisher:
McGraw Hill

Holt Mcdougal Larson Pre-algebra: Student Edition…
Algebra
ISBN:
9780547587776
Author:
HOLT MCDOUGAL
Publisher:
HOLT MCDOUGAL
Glencoe Algebra 1, Student Edition, 9780079039897…
Algebra
ISBN:
9780079039897
Author:
Carter
Publisher:
McGraw Hill
Holt Mcdougal Larson Pre-algebra: Student Edition…
Algebra
ISBN:
9780547587776
Author:
HOLT MCDOUGAL
Publisher:
HOLT MCDOUGAL