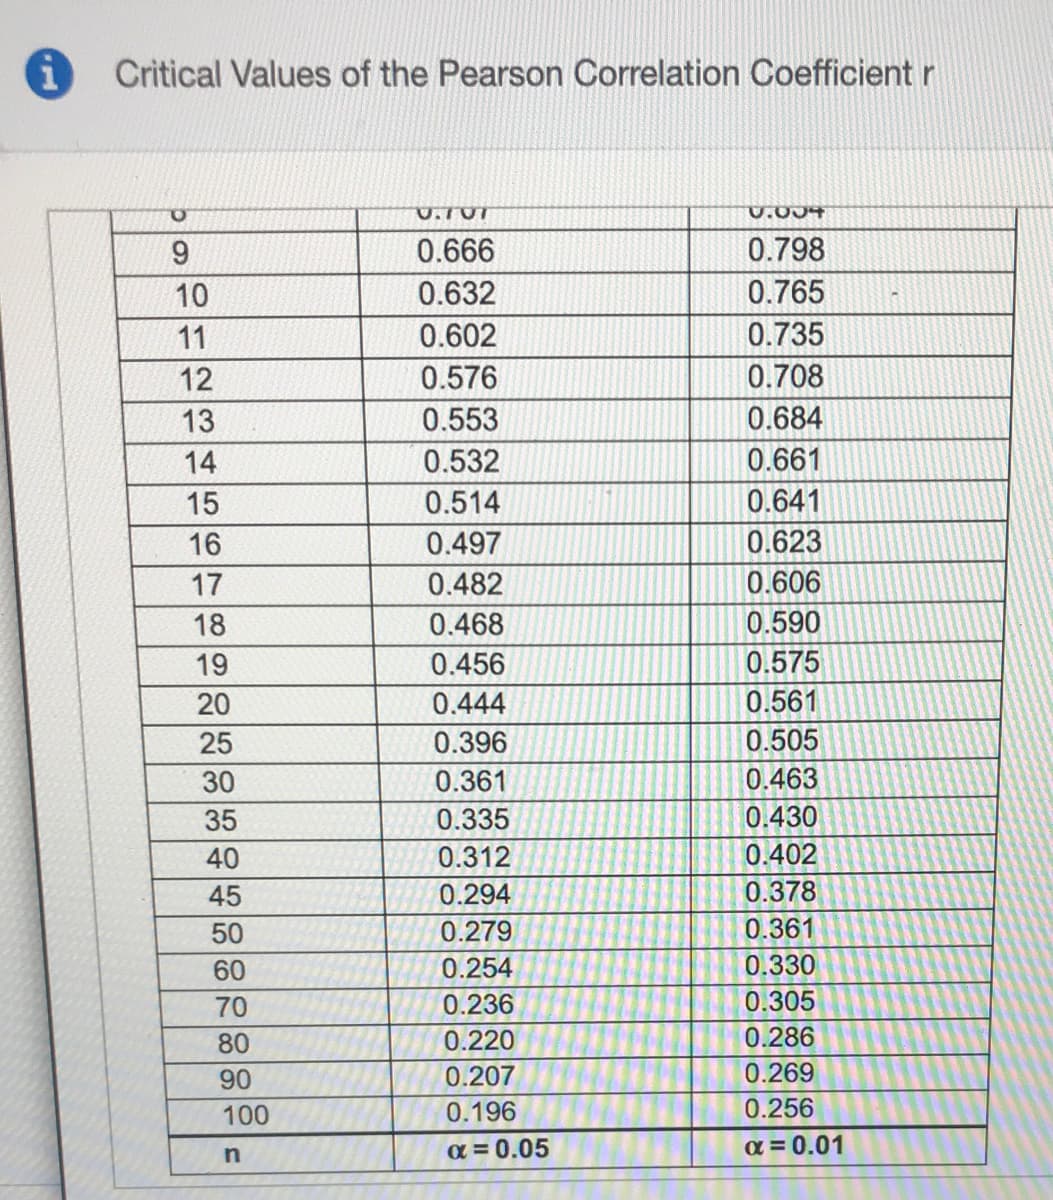
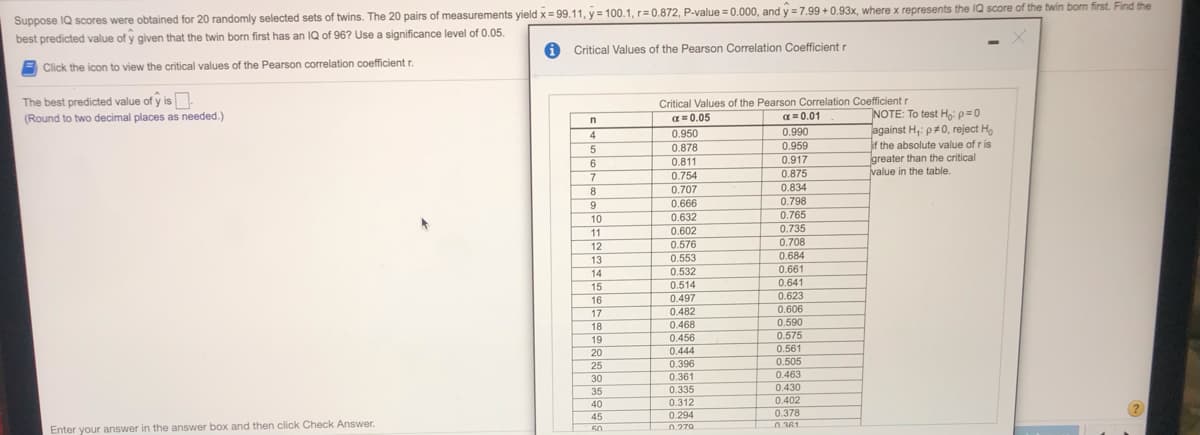
Suppose IQ scores were obtained for 20 randomly selected sets of twins. The 20 pairs of measurements yield x= 99.11, y = 100.1, r= 0.872, P-value = 0.000, and y = 7.99 +0.93x, where x represents the IQ score of the twin bom first. Find the best predicted value of y given that the twin born first has an IQ of 96? Use a significance level of 0.05. O Critical Values of the Pearson Correlation Coefficient r Click the icon to view the critical values of the Pearson correlation coefficient r. The best predicted value of y is. (Round to two decimal places as needed.) Critical Values of the Pearson Correlation Coefficient r NOTE: To test H: p=0 against H,: p#0, reject Ho if the absolute value of ris greater than the critical value in the table. a= 0.05 a = 0.01 0.950 0.990 0.878 0.959 0.811 0.917 7 0.754 0.875 0.834 0.798 8 0.707 9 0.666 0.632 0.765 0.735 0.708 10 0.602 0.576 0.553 11 12 0.684 13 14 0.532 0.661 0.641 0.623 0.606 0.514 15 16 17 0.497 0.482 0.468 0.456 0.590 0.575 0.561 0.505 0.463 0.430 0.402 18 19 20 0.444 25 0.396 30 0.361 35 40 0.335 0.312


Correlation
Correlation defines a relationship between two independent variables. It tells the degree to which variables move in relation to each other. When two sets of data are related to each other, there is a correlation between them.
Linear Correlation
A correlation is used to determine the relationships between numerical and categorical variables. In other words, it is an indicator of how things are connected to one another. The correlation analysis is the study of how variables are related.
Regression Analysis
Regression analysis is a statistical method in which it estimates the relationship between a dependent variable and one or more independent variable. In simple terms dependent variable is called as outcome variable and independent variable is called as predictors. Regression analysis is one of the methods to find the trends in data. The independent variable used in Regression analysis is named Predictor variable. It offers data of an associated dependent variable regarding a particular outcome.


Trending now
This is a popular solution!

Step by step
Solved in 2 steps with 2 images


