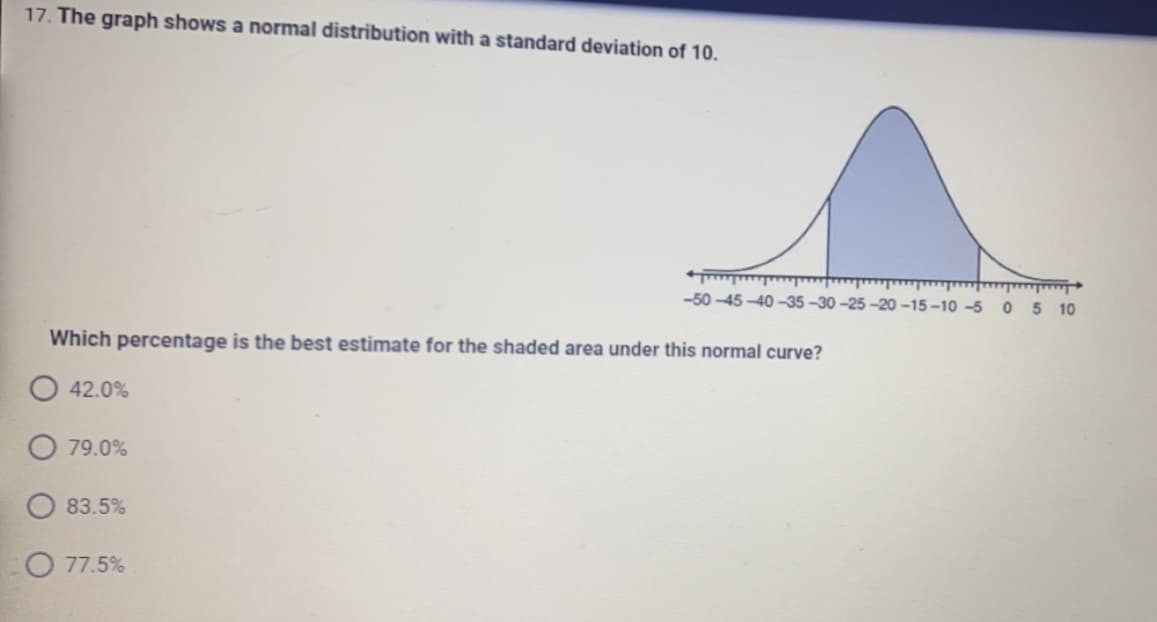
Which percentage is the best estimate for the shaded area under this normal curve?


Q: Question 4 Identify the population and sample in the following survey: The administration at a…
A: To find: Population and sample of the survey.
Q: When bonding teeth, orthodontists must maintain a dry field. A new bonding adhesive has been…
A: Given: Sample size n = 12 Sample mean X = 5.48 Sample standard deviation s = 0.38 Significance level…
Q: 11. [ 12. [ ; .¹ Simplify 8(2x - 3)- 4(5x – 7) Solve the equation 3(2x - 5) 2 (7x + 9) = 39
A:
Q: 6. The front row in a movie theatre has 23 seats. If you were asked to sit in the seat that occupied…
A: Formula : Median = (n+1)/2
Q: Statistical Analysis - Data Management For the following graph, answer the following: mean,…
A: Since you have posted a question with multiple sub-parts, we will solve the first three sub-parts…
Q: Activity 1: FILL ME OUT! Direction: Fill out the missing parts of the table. Some parts of the table…
A: Since you have posted a question with multiple sub-parts, we will solve the first three sub-parts…
Q: Let X have a normal distribution with a mean of 170 and a standard deviation of 21. The z-value that…
A:
Q: PROBLEM 1: Mike performs 2000 significance tests using a significance level 0.10. Under the…
A: "Since you have asked multiple question ,we will solve the first question for you .If you want any…
Q: 2. The average charitable contribution itemized per income tax return in Pennsylvania is $792.…
A: 2) Given, The average charitable contribution itemized per income tax return in Pennsylvania is…
Q: A. -0.06 B. 0 C. 0.11 21. Which of the following statements about correlation is NOT correct? A.…
A: (21) We have given that, We have to check which of the following statements about correlation is…
Q: Question 2 The Zambian average for the number of students per teacher for all public schools is…
A: Given S=2.1 n=12 x-bar=19.2
Q: A B C D There is a trend in the residuals There is autocorrelation in the residuals The residuals…
A: Given information: Graph=average price ending in 6 december 2015n=20Graph shows=plotted residuals
Q: 1. The researcher can claim both the null hypothesis and the alternative hypothesis at the same time…
A: It is given that the statements. Here, need to find out the true or false for the given statements.…
Q: A. Compute for Coefficient of r Let x ΣΥ Ξ [x² = Y n= [x = [xy = £y = r= Analysis & Interpretation…
A: Solution-: Let, X=Weight (lbs) and Y=Chest size (cm) We have following data: X Y 5.64 29.5…
Q: Given the plot of normal distributions A and B below, which of the following statements is true?…
A:
Q: A certain statistics instructor participates in triathlons. The accompanying table lists times (in…
A: Since, we answer only up to three sub parts of a problem, we'll be answering the first three sub…
Q: Samples of two types of life and following da
A: Given, For Type I : sample size (n1) = 8 sample mean (x̄1) = 1234 sample standard deviation (s1) =…
Q: Strands of copper wire from a manufacturer are analyzed for strength and conductivity. The results…
A: Given 100 strands
Q: Let X and Y be jointly continuous random variables with joint PDF given by: fxy(x,y) = X (1+3y²) I…
A: Given that The joint pdf of X and Y is f(x,y)=1/4x(1+3y2) We have to find a...Conditional pdf of…
Q: Indicate the given, required variable, and complete solution in the following problems: 1. Determine…
A: Given: Reaction is, CO(g)+H2O(g)→CO2(g)+H2(g) Substance CO(g) H2O(g) CO2(g) H2(g) ∆Hof(KJ/mol)…
Q: Test whether there is a significant difference in the average miles per gallon performance (mpg)…
A: Given Information: Consider the given sorted data: MPG-Automatic MPG-Manual 21.4 21 18.7 21…
Q: Analysis of Mercury in Fish Trial verage td. Dev. Relative Std. Dev. 6 Relative Standard Deviation 1…
A: Given : Trial ppb (Hg) 1 5.4 2 2.9 3 5.1 4 4.2 5 5.6 6 4.7 7 7.9 8 4.8 9 7.6…
Q: Find the indicated area under the standard normal curve Between z = - 0.15 and z = 0.15
A:
Q: C. Solve the following problem. You want to estimate the mean gasoline price within your town to the…
A: It is given that Margin of error, E = 5 Standard deviation, σ = 25
Q: Random samples of resting heart rates are taken from two groups. Population 1 exercises regularly,…
A:
Q: TRUE OR FALSE A type I error occurs when a researcher unknowingly obtains an extreme…
A:
Q: 2. Suppose the PMF of the random variable X is px(x) =p(1-p)*(0,1...(x) where p is a constant…
A:
Q: For safety reasons, calf dehorning has become a routine practice at dairy farms. A report from a…
A: From the provided information, Sample size (n) = 621 From which 504 dehorned calves. Level of…
Q: terval for the average number of days of cl ollege students miss each year. The data bel now the…
A: Given n=11
Q: 1. A student listed 10 of his classmates' scores: 34, 42, 27, 34, 45, 32, 31, 44, 33, 31 a.…
A: Given: Sample size n = 10 Formula Used: Mean = X1+X2+X3+...........+Xnn Median = n2thovservation +…
Q: Samples of two types of electric light bulbs were tested for the length of life and following data…
A: Hypothesis testing is an inferential statistical procedure.
Q: 4.3 Consider the simple linear regression model fit to the solar energy data. DATA SETS FOR…
A: Given data, simple linear regression fit to the solar energy data. y x1 x2 x3 x4 x5 271.8…
Q: What are the odds against randomly picking a green apple from a fruit bowl containing seven green…
A: Given 7 green apple 4 red apple
Q: 4. The mean weight of five complete computer stations is 167.2 pounds. The weights of four of the…
A: Given, The mean weight of five complete computer stations is 167.2 pounds. The weighs of four of the…
Q: Calculate σ2, and σ.
A: It is given that the probability distribution in table form x values with corresponding…
Q: Mr. and Mrs. Brown were married last October 2021 in Ocean view of Nahant in Massachusetts, USA.…
A: Given that, Mr. and Mrs. Brown were planning to have 3 children. If none of the 3 is a boy, they…
Q: Let X be a normally distributed random variable. Consider the sampling distribution of . Find the…
A: Given info:
Q: The percentage of physicians who are women is 32%. In a survey of physicians employed by a large…
A: a. Consider that p is the true proportion of women physicians at the university health system.
Q: 5.3 The data shown below present the average number of surviving bacteria in a canned food product…
A: Given data: Number of Bacteria Minutes of Exposure 175 1 108 2 95 3 82 4 71 5 50 6…
Q: Each of you are assigned a data set for the regression project (if you are not interested in…
A: Given information: Data assigned: For regression project Condition on which data assigned: Data is…
Q: ABC manufacturing company producing 6000 steel cylinders operators. The Quality Control department…
A: Sampling Methods for conducting the survey Data are the basic material needed for effective…
Q: Ten soldiers participated in a shooting competition in the first week. After intensive training they…
A: Paired t-test statistic: In order to test a hypothesis regarding whether the difference between a…
Q: Each of you are assigned a data set for the regression project (if you are not interested in…
A: Given information: Assigning of data: Regression project Purpose of assigning: To earn extra credit…
Q: STATISTICS AND PROBABILITY (Answer only. NO long explanation needed. Rate will be given) Choose…
A:
Q: STATISTICS AND PROBABILITY (Answer only. NO long explanation needed. Rate will be given) What is…
A:
Q: STATISTICS AND PROBABILITY (Answer only. NO long explanation needed. Rate will be given) Which of…
A: We have to identify Which of the following represents this graph of a standard normal distribution?…
Q: A sample is selected from a normal population, and resulting data are as follows: 45.2, 51.5, 49.4,…
A: a. Null hypothesis: H0: µ = 50. Alternative hypothesis: H1: µ >50.
Q: Renata takes a sample of 25 different-gender married couples. In her sample, she found that the…
A:
Q: You are interested in finding a 98% confidence interval for the average number of days of class that…
A: a. In this case, the population standard deviation is unknown.
Q: The following table shows the annual family income of the students enrolled in the JRMSU-TC and…
A: Excel procedure to plot regression line: Enter the data in an excel sheet. Select the data of two…


Trending now
This is a popular solution!

Step by step
Solved in 2 steps
