Suppose that a company operates in the monopolistically competitive market for denim jackets. The following graph shows the demand curve, marginal revenue (MR) curve, marginal cost (MC) curve, and average total cost (ATC) curve for the firm. Place a black point (plus symbol) on the graph to indicate the long-run monopolistically competitive equilibrium price and quantity for this firm. Next, place a grey point (star symbol) to indicate the minimum average total cost the firm faces and the quantity associated with that cost. ? PRICE (Dollars per jacket) 100 90 80 70 60 40 30 20 MC 10 ATC MR Demand 0 0 10 20 30 40 50 60 70 80 90 100 QUANTITY (Thousands of jackets) + Mon Comp Outcome Min Unit Cost Because this market is monopolistically competitive, you can tell that it is in long-run equilibrium by the fact that. firm. Further, a monopolistically competitive firm's average total cost in long-run equilibrium is at the optimal quantity for each the minimum average total cost.
Suppose that a company operates in the monopolistically competitive market for denim jackets. The following graph shows the demand curve, marginal revenue (MR) curve, marginal cost (MC) curve, and average total cost (ATC) curve for the firm. Place a black point (plus symbol) on the graph to indicate the long-run monopolistically competitive equilibrium price and quantity for this firm. Next, place a grey point (star symbol) to indicate the minimum average total cost the firm faces and the quantity associated with that cost. ? PRICE (Dollars per jacket) 100 90 80 70 60 40 30 20 MC 10 ATC MR Demand 0 0 10 20 30 40 50 60 70 80 90 100 QUANTITY (Thousands of jackets) + Mon Comp Outcome Min Unit Cost Because this market is monopolistically competitive, you can tell that it is in long-run equilibrium by the fact that. firm. Further, a monopolistically competitive firm's average total cost in long-run equilibrium is at the optimal quantity for each the minimum average total cost.

Microeconomics A Contemporary Intro
10th Edition
ISBN:9781285635101
Author:MCEACHERN
Publisher:MCEACHERN
Chapter10: Monopolistic Competition And Oligopoly
Section: Chapter Questions
Problem 11PAE
Question
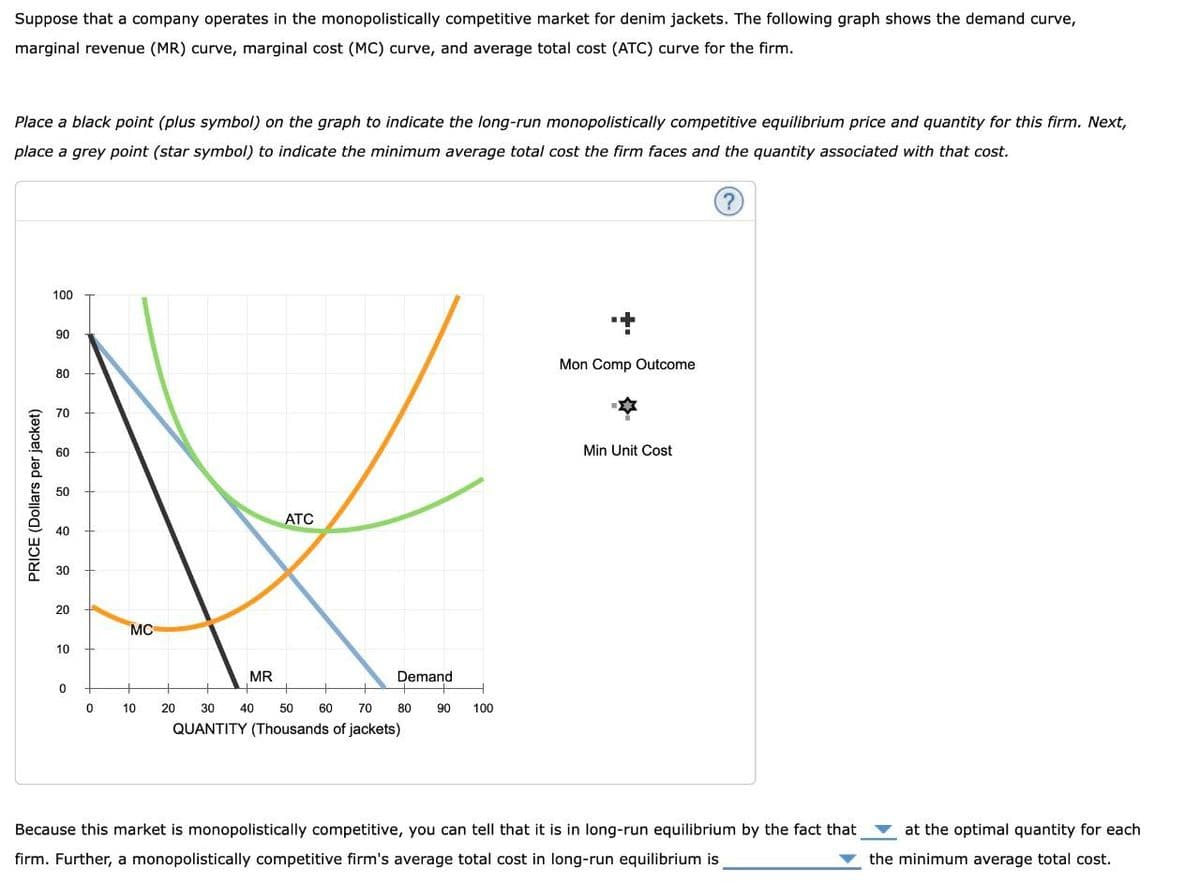
Transcribed Image Text:Suppose that a company operates in the monopolistically competitive market for denim jackets. The following graph shows the demand curve,
marginal revenue (MR) curve, marginal cost (MC) curve, and average total cost (ATC) curve for the firm.
Place a black point (plus symbol) on the graph to indicate the long-run monopolistically competitive equilibrium price and quantity for this firm. Next,
place a grey point (star symbol) to indicate the minimum average total cost the firm faces and the quantity associated with that cost.
?
PRICE (Dollars per jacket)
100
90
80
70
60
40
30
20
MC
10
ATC
MR
Demand
0
0 10
20
30
40
50
60
70 80 90 100
QUANTITY (Thousands of jackets)
+
Mon Comp Outcome
Min Unit Cost
Because this market is monopolistically competitive, you can tell that it is in long-run equilibrium by the fact that.
firm. Further, a monopolistically competitive firm's average total cost in long-run equilibrium is
at the optimal quantity for each
the minimum average total cost.
Expert Solution
This question has been solved!
Explore an expertly crafted, step-by-step solution for a thorough understanding of key concepts.

This is a popular solution!

Trending now
This is a popular solution!

Step by step
Solved in 2 steps

Recommended textbooks for you


Exploring Economics
Economics
ISBN:
9781544336329
Author:
Robert L. Sexton
Publisher:
SAGE Publications, Inc

Managerial Economics: A Problem Solving Approach
Economics
ISBN:
9781337106665
Author:
Luke M. Froeb, Brian T. McCann, Michael R. Ward, Mike Shor
Publisher:
Cengage Learning