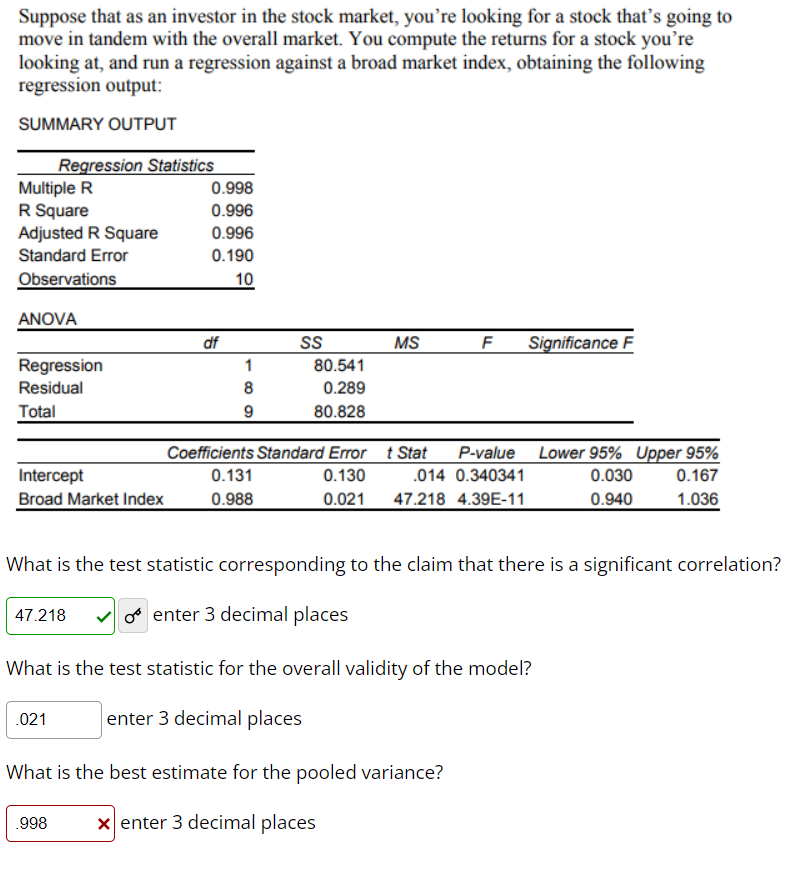
Suppose that as an investor in the stock market, you're looking for a stock that's going to move in tandem with the overall market. You compute the returns for a stock you're looking at, and run a regression against a broad market index, obtaining the following regression output: SUMMARY OUTPUT Multiple R R Square Adjusted R Square Standard Error Observations Regression Statistics ANOVA Regression Residual Total Intercept Broad Market Index 021 0.998 0.996 0.996 0.190 10 998 df 1 8 9 SS 0.131 0.988 80.541 0.289 80.828 MS F Coefficients Standard Errort Stat P-value 0.130 .014 0.340341 0.021 47.218 4.39E-11 Significance F What is the test statistic corresponding to the claim that there is a significant correlation? 47.218 o enter 3 decimal places What is the test statistic for the overall validity of the model? enter 3 decimal places What is the best estimate for the pooled variance? xenter 3 decimal places Lower 95% Upper 95% 0.030 0.167 0.940 1.036
Suppose that as an investor in the stock market, you're looking for a stock that's going to move in tandem with the overall market. You compute the returns for a stock you're looking at, and run a regression against a broad market index, obtaining the following regression output: SUMMARY OUTPUT Multiple R R Square Adjusted R Square Standard Error Observations Regression Statistics ANOVA Regression Residual Total Intercept Broad Market Index 021 0.998 0.996 0.996 0.190 10 998 df 1 8 9 SS 0.131 0.988 80.541 0.289 80.828 MS F Coefficients Standard Errort Stat P-value 0.130 .014 0.340341 0.021 47.218 4.39E-11 Significance F What is the test statistic corresponding to the claim that there is a significant correlation? 47.218 o enter 3 decimal places What is the test statistic for the overall validity of the model? enter 3 decimal places What is the best estimate for the pooled variance? xenter 3 decimal places Lower 95% Upper 95% 0.030 0.167 0.940 1.036

MATLAB: An Introduction with Applications
6th Edition
ISBN:9781119256830
Author:Amos Gilat
Publisher:Amos Gilat
Chapter1: Starting With Matlab
Section: Chapter Questions
Problem 1P

Related questions
Question
Transcribed Image Text:Suppose that as an investor in the stock market, you're looking for a stock that's going to
move in tandem with the overall market. You compute the returns for a stock you're
looking at, and run a regression against a broad market index, obtaining the following
regression output:
SUMMARY OUTPUT
Multiple R
R Square
Adjusted R Square
Standard Error
Observations
Regression Statistics
ANOVA
Regression
Residual
Total
Intercept
Broad Market Index
47.218
.021
0.998
0.996
0.996
0.190
10
.998
df
1
8
9
SS
0.131
0.988
80.541
0.289
80.828
MS
LL
F
Coefficients Standard Errort Stat
P-value
.014 0.340341
0.130
0.021 47.218 4.39E-11
What is the test statistic corresponding to the claim that there is a significant correlation?
o enter 3 decimal places
Significance F
What is the test statistic for the overall validity of the model?
enter 3 decimal places
What is the best estimate for the pooled variance?
xenter 3 decimal places
Lower 95% Upper 95%
0.030
0.167
0.940
1.036
Expert Solution
This question has been solved!
Explore an expertly crafted, step-by-step solution for a thorough understanding of key concepts.

This is a popular solution!

Trending now
This is a popular solution!

Step by step
Solved in 3 steps

Recommended textbooks for you
MATLAB: An Introduction with Applications
Statistics
ISBN:
9781119256830
Author:
Amos Gilat
Publisher:
John Wiley & Sons Inc

Probability and Statistics for Engineering and th…
Statistics
ISBN:
9781305251809
Author:
Jay L. Devore
Publisher:
Cengage Learning

Statistics for The Behavioral Sciences (MindTap C…
Statistics
ISBN:
9781305504912
Author:
Frederick J Gravetter, Larry B. Wallnau
Publisher:
Cengage Learning
MATLAB: An Introduction with Applications
Statistics
ISBN:
9781119256830
Author:
Amos Gilat
Publisher:
John Wiley & Sons Inc
Probability and Statistics for Engineering and th…
Statistics
ISBN:
9781305251809
Author:
Jay L. Devore
Publisher:
Cengage Learning
Statistics for The Behavioral Sciences (MindTap C…
Statistics
ISBN:
9781305504912
Author:
Frederick J Gravetter, Larry B. Wallnau
Publisher:
Cengage Learning

Elementary Statistics: Picturing the World (7th E…
Statistics
ISBN:
9780134683416
Author:
Ron Larson, Betsy Farber
Publisher:
PEARSON

The Basic Practice of Statistics
Statistics
ISBN:
9781319042578
Author:
David S. Moore, William I. Notz, Michael A. Fligner
Publisher:
W. H. Freeman

Introduction to the Practice of Statistics
Statistics
ISBN:
9781319013387
Author:
David S. Moore, George P. McCabe, Bruce A. Craig
Publisher:
W. H. Freeman