Suppose that Congress caps executive pay at a level below the market equilibrium. The graph shows the market for corporate executives. Draw a line to show a cap on executive pay at a level below the market equilibrium. Label it Pay cap. Draw a point to show the quantity demanded at the pay cap. Label it 1. Draw a point to show the quantity supplied at the pay cap. Label is 2. Draw a shape that represents the deadweight loss created by the pay cap. Label DWL. Draw a point to show the highest pay that an executive might be offered in a black market. Label it 3. 10- 8- 2- 0 Executive compensation (millions of dollars per year) 0 S D 1 2 3 Quantity (thousands of executives) >>> Draw only the objects specified in the question.
Suppose that Congress caps executive pay at a level below the market equilibrium. The graph shows the market for corporate executives. Draw a line to show a cap on executive pay at a level below the market equilibrium. Label it Pay cap. Draw a point to show the quantity demanded at the pay cap. Label it 1. Draw a point to show the quantity supplied at the pay cap. Label is 2. Draw a shape that represents the deadweight loss created by the pay cap. Label DWL. Draw a point to show the highest pay that an executive might be offered in a black market. Label it 3. 10- 8- 2- 0 Executive compensation (millions of dollars per year) 0 S D 1 2 3 Quantity (thousands of executives) >>> Draw only the objects specified in the question.

Essentials of Economics (MindTap Course List)
8th Edition
ISBN:9781337091992
Author:N. Gregory Mankiw
Publisher:N. Gregory Mankiw
Chapter6: Supply, Demand And Government Policies
Section6.2: Taxes
Problem 2QQ

Related questions
Question
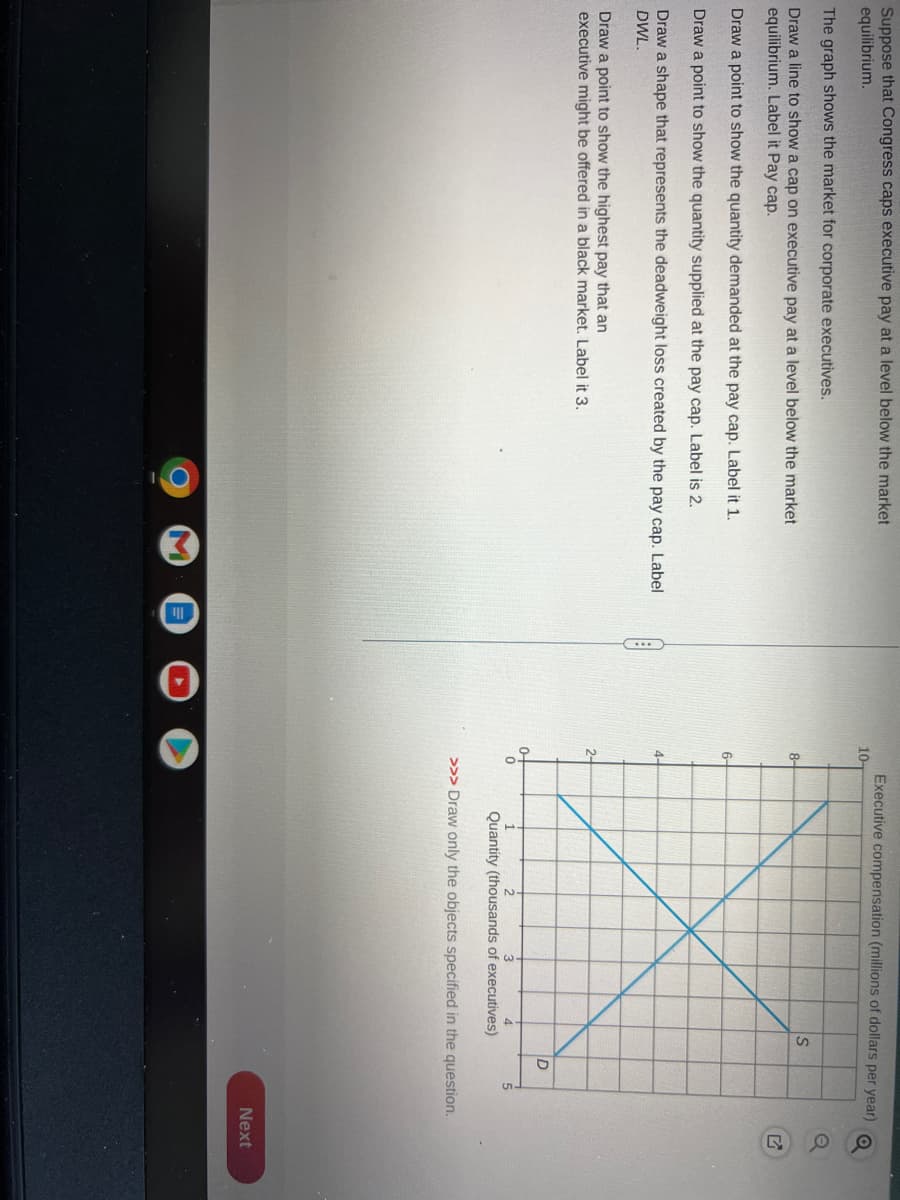
Transcribed Image Text:Suppose that Congress caps executive pay at a level below the market
equilibrium.
The graph shows the market for corporate executives.
Draw a line to show a cap on executive pay at a level below the market
equilibrium. Label it Pay cap.
Draw a point to show the quantity demanded at the pay cap. Label it 1.
Draw a point to show the quantity supplied at the pay cap. Label is 2.
Draw a shape that represents the deadweight loss created by the pay cap. Label
DWL.
Draw a point to show the highest pay that an
executive might be offered in a black market. Label it 3.
10
8-
6-
2-
0-
0
Q
Executive compensation (millions of dollars per year)
S
4
D
1
3
Quantity (thousands of executives)
>>> Draw only the objects specified in the question.
5
G
Next
Expert Solution
This question has been solved!
Explore an expertly crafted, step-by-step solution for a thorough understanding of key concepts.

This is a popular solution!

Trending now
This is a popular solution!

Step by step
Solved in 3 steps with 1 images

Knowledge Booster


Learn more about
Need a deep-dive on the concept behind this application? Look no further. Learn more about this topic, economics and related others by exploring similar questions and additional content below.Recommended textbooks for you
Essentials of Economics (MindTap Course List)
Economics
ISBN:
9781337091992
Author:
N. Gregory Mankiw
Publisher:
Cengage Learning

Exploring Economics
Economics
ISBN:
9781544336329
Author:
Robert L. Sexton
Publisher:
SAGE Publications, Inc

Economics (MindTap Course List)
Economics
ISBN:
9781337617383
Author:
Roger A. Arnold
Publisher:
Cengage Learning
Essentials of Economics (MindTap Course List)
Economics
ISBN:
9781337091992
Author:
N. Gregory Mankiw
Publisher:
Cengage Learning
Exploring Economics
Economics
ISBN:
9781544336329
Author:
Robert L. Sexton
Publisher:
SAGE Publications, Inc
Economics (MindTap Course List)
Economics
ISBN:
9781337617383
Author:
Roger A. Arnold
Publisher:
Cengage Learning

