Suppose that Edison and Hilary are the only consumers of pizza slices in a particular market. The following table shows their annual demand schedules: Price (Dollars per slice) 1 PRICE (Dollars per slice) 6 5 N On the following graph, plot Edison's demand for pizza slices using the green points (triangle symbol). Next, plot Hilary's demand for pizza slices using the purple points (diamond symbol). hally, plot the market demand for pizza slices using the blue points (circle symbol). Note: Line segments will automatically connect the points. Remember to plot from left to right. 1 0 2 3 0 4 5 20 Edison's Quantity Demanded Hilary's Quantity Demanded (Slices) (Slices) 40 60 25 40 15 30 5 20 0 40 60 80 QUANTITY (Slices) 100 10 120 Edison's Demand Hilary's Demand 。 Market Demand
Suppose that Edison and Hilary are the only consumers of pizza slices in a particular market. The following table shows their annual demand schedules: Price (Dollars per slice) 1 PRICE (Dollars per slice) 6 5 N On the following graph, plot Edison's demand for pizza slices using the green points (triangle symbol). Next, plot Hilary's demand for pizza slices using the purple points (diamond symbol). hally, plot the market demand for pizza slices using the blue points (circle symbol). Note: Line segments will automatically connect the points. Remember to plot from left to right. 1 0 2 3 0 4 5 20 Edison's Quantity Demanded Hilary's Quantity Demanded (Slices) (Slices) 40 60 25 40 15 30 5 20 0 40 60 80 QUANTITY (Slices) 100 10 120 Edison's Demand Hilary's Demand 。 Market Demand

Essentials of Economics (MindTap Course List)
8th Edition
ISBN:9781337091992
Author:N. Gregory Mankiw
Publisher:N. Gregory Mankiw
Chapter5: Elastic And Its Application
Section: Chapter Questions
Problem 10PA

Related questions
Question
100%
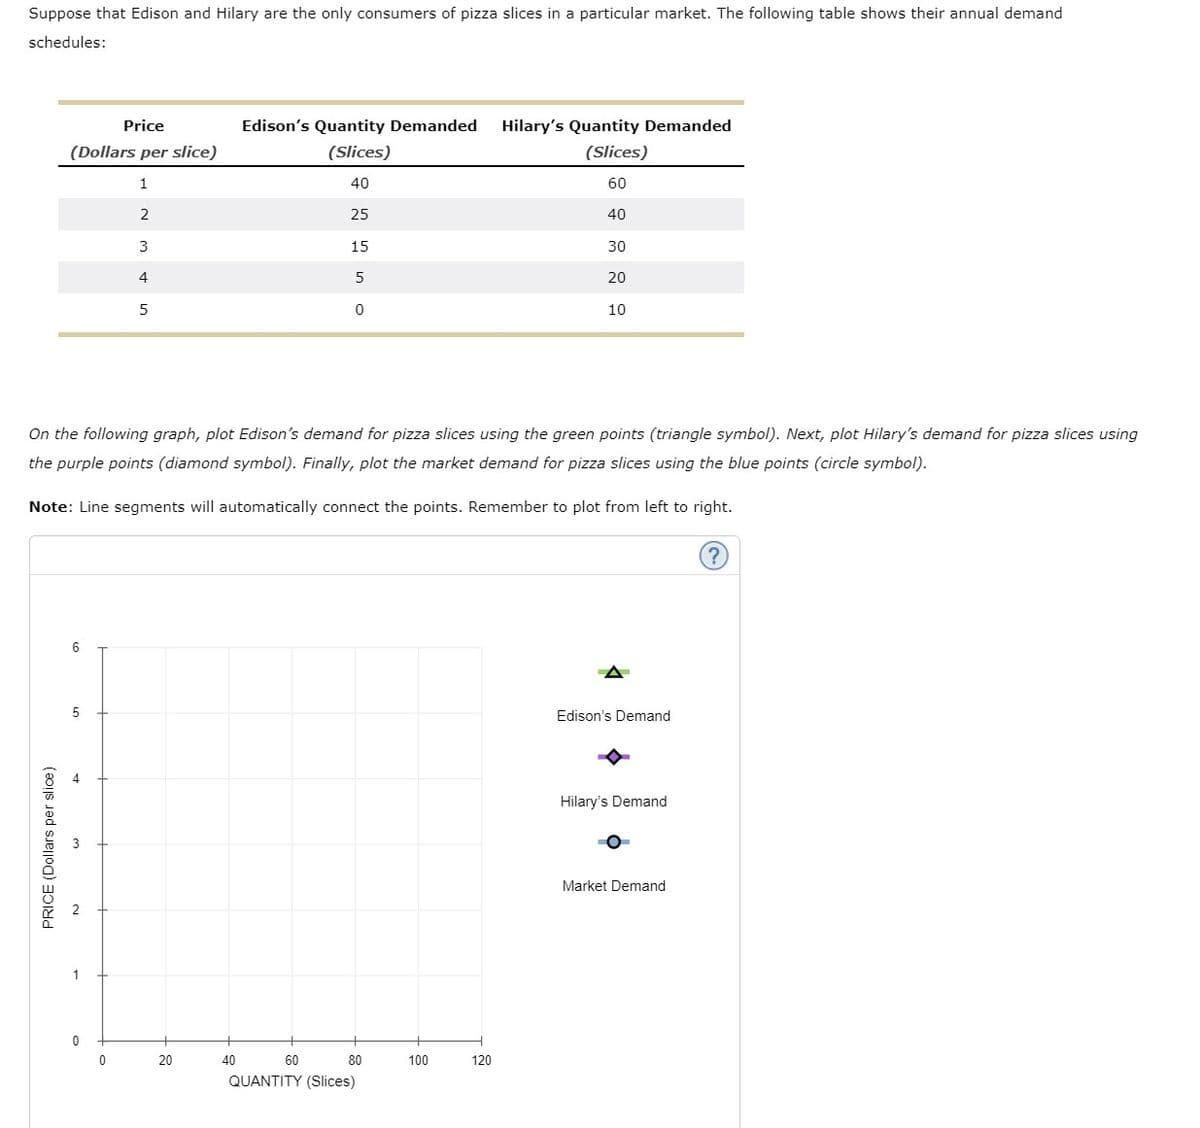
Transcribed Image Text:Suppose that Edison and Hilary are the only consumers of pizza slices in a particular market. The following table shows their annual demand
schedules:
Price
(Dollars per slice)
1
2
3
4
5
PRICE (Dollars per slice)
6
5
On the following graph, plot Edison's demand for pizza slices using the green points (triangle symbol). Next, plot Hilary's demand for pizza slices using
the purple points (diamond symbol). Finally, plot the market demand for pizza slices using the blue points (circle symbol).
Note: Line segments will automatically connect the points. Remember to plot from left to right.
0
0
20
Edison's Quantity Demanded Hilary's Quantity Demanded
(Slices)
(Slices)
40
60
25
40
15
5
0
40
60
80
QUANTITY (Slices)
100
30
120
20
10
Edison's Demand
Hilary's Demand
Market Demand
Expert Solution
This question has been solved!
Explore an expertly crafted, step-by-step solution for a thorough understanding of key concepts.

This is a popular solution!

Trending now
This is a popular solution!

Step by step
Solved in 2 steps with 1 images

Knowledge Booster


Learn more about
Need a deep-dive on the concept behind this application? Look no further. Learn more about this topic, economics and related others by exploring similar questions and additional content below.Recommended textbooks for you
Essentials of Economics (MindTap Course List)
Economics
ISBN:
9781337091992
Author:
N. Gregory Mankiw
Publisher:
Cengage Learning

Exploring Economics
Economics
ISBN:
9781544336329
Author:
Robert L. Sexton
Publisher:
SAGE Publications, Inc

Essentials of Economics (MindTap Course List)
Economics
ISBN:
9781337091992
Author:
N. Gregory Mankiw
Publisher:
Cengage Learning
Exploring Economics
Economics
ISBN:
9781544336329
Author:
Robert L. Sexton
Publisher:
SAGE Publications, Inc

Economics Today and Tomorrow, Student Edition
Economics
ISBN:
9780078747663
Author:
McGraw-Hill
Publisher:
Glencoe/McGraw-Hill School Pub Co

Brief Principles of Macroeconomics (MindTap Cours…
Economics
ISBN:
9781337091985
Author:
N. Gregory Mankiw
Publisher:
Cengage Learning
