The following graph shows the market demand for ice cream. Suppose that the price of cake, a complementary good for ice cream, Increases Show the impact of the increase in the price of cake by shifting the demand curve on the following graph PRICED per bemand QUANTITY (Otons of ice cream) 10 Demand
The following graph shows the market demand for ice cream. Suppose that the price of cake, a complementary good for ice cream, Increases Show the impact of the increase in the price of cake by shifting the demand curve on the following graph PRICED per bemand QUANTITY (Otons of ice cream) 10 Demand

Chapter4: Demand, Supply, And Market Equilibrium
Section: Chapter Questions
Problem 7P

Related questions
Question
Need help with this.
Please show explanation and where to move the lines. Or if you could draw them, it will help much !
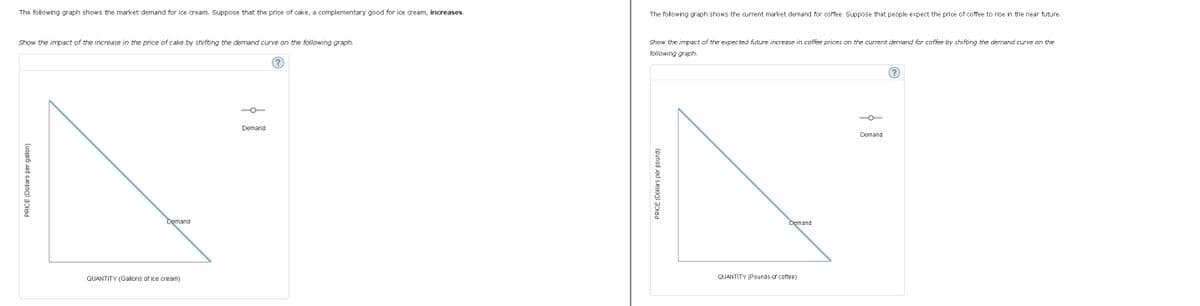
Transcribed Image Text:The following graph shows the market demand for ice cream. Suppose that the price of cake, a complementary good for ice cream, increases.
Show the impact of the increase in the price of cake by shifting the demand curve on the following graph.
PRICE (Dollars per gallon)
Demand
QUANTITY (Gallons of ice cream)
Demand
?
The following graph shows the current market demand for coffee. Suppose that people expect the price of coffee to rise in the near future.
Show the impact of the expected future increase in coffee prices on the current demand for coffee by shifting the demand curve on the
following graph.
PRICE (Dollars per pound)
Demand
QUANTITY (Pounds of coffee)
Demand
(?)
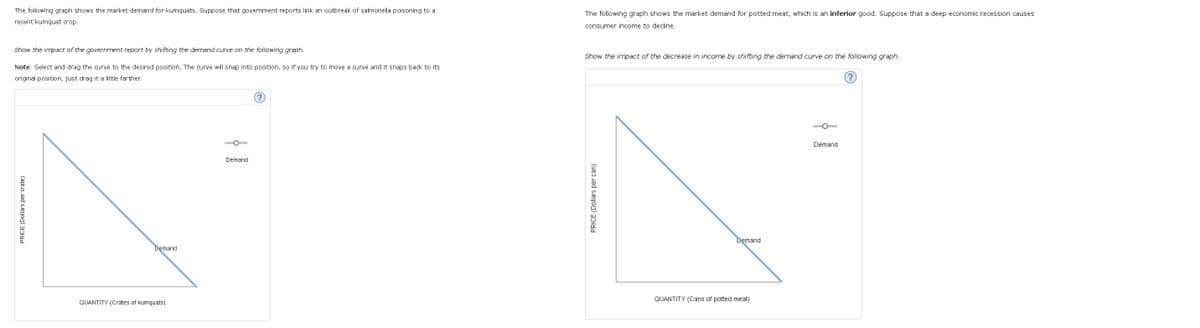
Transcribed Image Text:The following graph shows the market demand for kumquats. Suppose that government reports link an outbreak of salmonella poisoning to a
recent kumquat crop.
Show the impact of the government report by shifting the demand curve on the following graph.
Note: Select and drag the curve to the desired position. The curve will snap into position, so if you try to move a curve and it snaps back to its
original position, just drag it a little farther.
PRICE (Dollars per crate)
Demand
QUANTITY (Crates of kumquats)
Demand
The following graph shows the market demand for potted meat, which is an inferior good. Suppose that a deep economic recession causes
consumer income to decline.
Show the impact of the decrease in income by shifting the demand curve on the following graph.
PRICE (Dollars per can)
Demand
QUANTITY (Cans of potted meat)
Demand
Expert Solution
This question has been solved!
Explore an expertly crafted, step-by-step solution for a thorough understanding of key concepts.

This is a popular solution!

Trending now
This is a popular solution!

Step by step
Solved in 2 steps with 1 images

Follow-up Questions
Read through expert solutions to related follow-up questions below.
Follow-up Question
The following question that I posted is considered as a one question. Problem is that its long and that's why I split it into two different ScreenShots so you can see the graphs easily.
Solution
Knowledge Booster


Learn more about
Need a deep-dive on the concept behind this application? Look no further. Learn more about this topic, economics and related others by exploring similar questions and additional content below.Recommended textbooks for you
Exploring Economics
Economics
ISBN:
9781544336329
Author:
Robert L. Sexton
Publisher:
SAGE Publications, Inc

Economics Today and Tomorrow, Student Edition
Economics
ISBN:
9780078747663
Author:
McGraw-Hill
Publisher:
Glencoe/McGraw-Hill School Pub Co

Exploring Economics
Economics
ISBN:
9781544336329
Author:
Robert L. Sexton
Publisher:
SAGE Publications, Inc
Economics Today and Tomorrow, Student Edition
Economics
ISBN:
9780078747663
Author:
McGraw-Hill
Publisher:
Glencoe/McGraw-Hill School Pub Co


Economics (MindTap Course List)
Economics
ISBN:
9781337617383
Author:
Roger A. Arnold
Publisher:
Cengage Learning