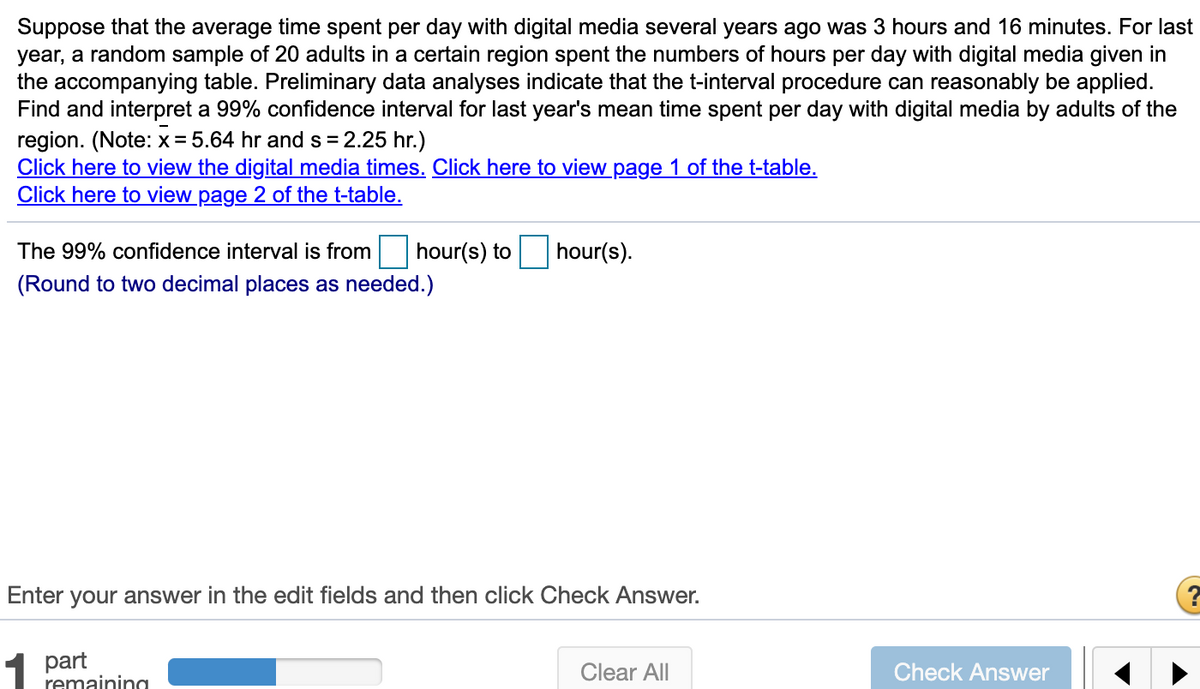
Suppose that the average time spent per day with digital media several years ago was 3 hours and 16 minutes. For last year, a random sample of 20 adults in a certain region spent the numbers of hours per day with digital media given in the accompanying table. Preliminary data analyses indicate that the t-interval procedure can reasonably be applied. Find and interpret a 99% confidence interval for last year's mean time spent per day with digital media by adults of the region. (Note: x = 5.64 hr and s = 2.25 hr.) Click here to view the digital media times. Click here to view page 1 of the t-table. Click here to view page 2 of the t-table. The 99% confidence interval is from hour(s) to hour(s). (Round to two decimal places as needed.)
Suppose that the average time spent per day with digital media several years ago was 3 hours and 16 minutes. For last year, a random sample of 20 adults in a certain region spent the numbers of hours per day with digital media given in the accompanying table. Preliminary data analyses indicate that the t-interval procedure can reasonably be applied. Find and interpret a 99% confidence interval for last year's mean time spent per day with digital media by adults of the region. (Note: x = 5.64 hr and s = 2.25 hr.) Click here to view the digital media times. Click here to view page 1 of the t-table. Click here to view page 2 of the t-table. The 99% confidence interval is from hour(s) to hour(s). (Round to two decimal places as needed.)

MATLAB: An Introduction with Applications
6th Edition
ISBN:9781119256830
Author:Amos Gilat
Publisher:Amos Gilat
Chapter1: Starting With Matlab
Section: Chapter Questions
Problem 1P

Related questions
Topic Video
Question
Suppose that the average time spent per day with digital media several years ago was 3 hours and 16 minutes. For last year, a random sample of 20 adults in a certain region spent the numbers of hours per day with digital media given in the accompanying table. Preliminary data analyses indicate that the t-interval procedure can reasonably be applied. Find and interpret a 99% confidence interval for last year's mean time spent per day with digital media by adults of the region. (Note: x=5.64 hr and s=2.25hr.)
Transcribed Image Text:Suppose that the average time spent per day with digital media several years ago was 3 hours and 16 minutes. For last
year, a random sample of 20 adults in a certain region spent the numbers of hours per day with digital media given in
the accompanying table. Preliminary data analyses indicate that the t-interval procedure can reasonably be applied.
Find and interpret a 99% confidence interval for last year's mean time spent per day with digital media by adults of the
region. (Note: x= 5.64 hr and s = 2.25 hr.)
Click here to view the digital media times. Click here to view page 1 of the t-table.
Click here to view page 2 of the t-table.
The 99% confidence interval is from
hour(s) to
hour(s).
(Round to two decimal places as needed.)
Enter your answer in the edit fields and then click Check Answer.
1
part
remainina
Clear All
Check Answer
Transcribed Image Text:1
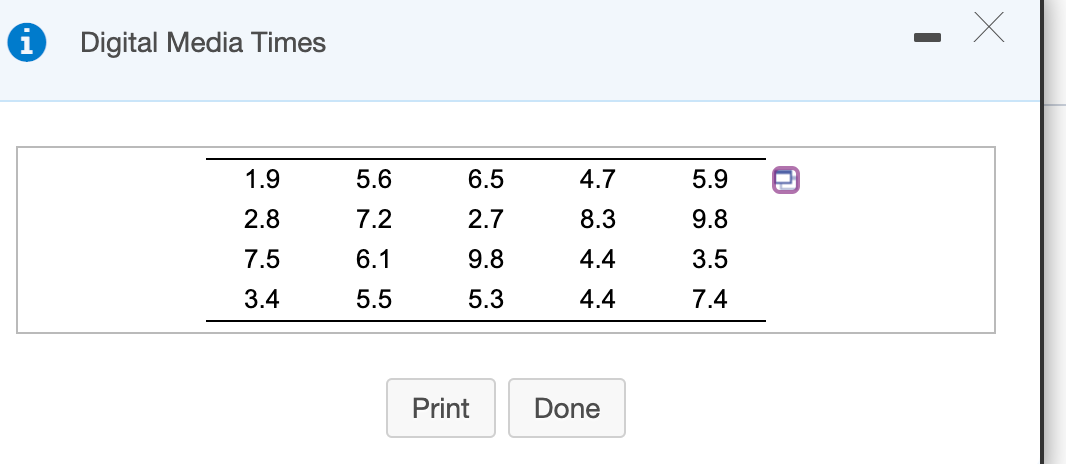
Digital Media Times
1.9
5.6
6.5
4.7
5.9
2.8
7.2
2.7
8.3
9.8
7.5
6.1
9.8
4.4
3.5
3.4
5.5
5.3
4.4
7.4
Print
Done
Expert Solution
This question has been solved!
Explore an expertly crafted, step-by-step solution for a thorough understanding of key concepts.

This is a popular solution!

Trending now
This is a popular solution!

Step by step
Solved in 2 steps with 1 images

Knowledge Booster


Learn more about
Need a deep-dive on the concept behind this application? Look no further. Learn more about this topic, statistics and related others by exploring similar questions and additional content below.Recommended textbooks for you
MATLAB: An Introduction with Applications
Statistics
ISBN:
9781119256830
Author:
Amos Gilat
Publisher:
John Wiley & Sons Inc

Probability and Statistics for Engineering and th…
Statistics
ISBN:
9781305251809
Author:
Jay L. Devore
Publisher:
Cengage Learning

Statistics for The Behavioral Sciences (MindTap C…
Statistics
ISBN:
9781305504912
Author:
Frederick J Gravetter, Larry B. Wallnau
Publisher:
Cengage Learning
MATLAB: An Introduction with Applications
Statistics
ISBN:
9781119256830
Author:
Amos Gilat
Publisher:
John Wiley & Sons Inc
Probability and Statistics for Engineering and th…
Statistics
ISBN:
9781305251809
Author:
Jay L. Devore
Publisher:
Cengage Learning
Statistics for The Behavioral Sciences (MindTap C…
Statistics
ISBN:
9781305504912
Author:
Frederick J Gravetter, Larry B. Wallnau
Publisher:
Cengage Learning

Elementary Statistics: Picturing the World (7th E…
Statistics
ISBN:
9780134683416
Author:
Ron Larson, Betsy Farber
Publisher:
PEARSON

The Basic Practice of Statistics
Statistics
ISBN:
9781319042578
Author:
David S. Moore, William I. Notz, Michael A. Fligner
Publisher:
W. H. Freeman

Introduction to the Practice of Statistics
Statistics
ISBN:
9781319013387
Author:
David S. Moore, George P. McCabe, Bruce A. Craig
Publisher:
W. H. Freeman