Suppose that the supply of tomato soup in a city is represented by Qs = 100P – 10P - 50 where P is the price of tomato soup and Pr is price of tomato needed to produce tomato soup. All prices are in dollars and quantity is in liters. Assume that the current tomato price is $15. Suppose that the demand for the tomato soup is QD = 1000–60P + 0.31 where P is the price of the tomato soup and I is a representative household's income. Assume that at the equilibrium, income is $12000. a) What are the current equilibrium price and quantity of the tomato soup? Show the equilibrium on a detailed graph. b) Suppose that income decreases to $10400. What is the new equation for the demand for tomato soup? Does this correspond to an increase or decrease in the demand for tomato soup? Show the effect of this event on the equilibrium and the diagram you used in part (a) c) Start from the equilibrium in part a) and now suppose that the price of the tomato increases to $47. What is the new equation for the supply of tomato soup? Does this correspond to an increase or decrease in supply of tomato soup? Show the effect of this event on the equilibrium and the diagram you used in part a)?
Suppose that the supply of tomato soup in a city is represented by Qs = 100P – 10P - 50 where P is the price of tomato soup and Pr is price of tomato needed to produce tomato soup. All prices are in dollars and quantity is in liters. Assume that the current tomato price is $15. Suppose that the demand for the tomato soup is QD = 1000–60P + 0.31 where P is the price of the tomato soup and I is a representative household's income. Assume that at the equilibrium, income is $12000. a) What are the current equilibrium price and quantity of the tomato soup? Show the equilibrium on a detailed graph. b) Suppose that income decreases to $10400. What is the new equation for the demand for tomato soup? Does this correspond to an increase or decrease in the demand for tomato soup? Show the effect of this event on the equilibrium and the diagram you used in part (a) c) Start from the equilibrium in part a) and now suppose that the price of the tomato increases to $47. What is the new equation for the supply of tomato soup? Does this correspond to an increase or decrease in supply of tomato soup? Show the effect of this event on the equilibrium and the diagram you used in part a)?

Chapter4: Demand, Supply, And Market Equilibrium
Section: Chapter Questions
Problem 25P

Related questions
Question
100%
The answer should be very detailed and clear, THANK YOU!!!
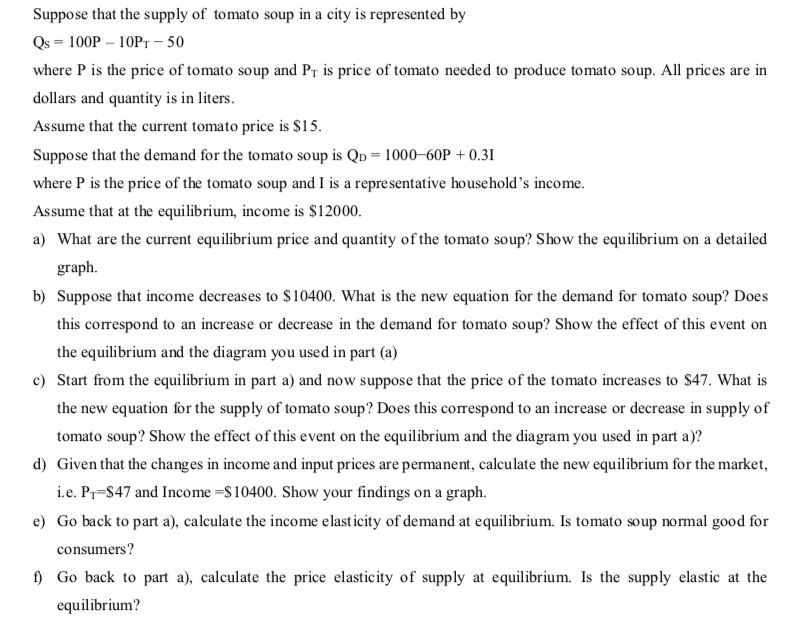
Transcribed Image Text:Suppose that the supply of tomato soup in a city is represented by
Qs = 100P – 10PT – 50
where P is the price of tomato soup and Pr is price of tomato needed to produce tomato soup. All prices are in
dollars and quantity is in liters.
Assume that the current tomato price is $15.
Suppose that the demand for the tomato soup is QD = 1000–60P + 0.31
where P is the price of the tomato soup and I is a representative household's income.
Assume that at the equilibrium, income is $12000.
a) What are the current equilibrium price and quantity of the tomato soup? Show the equilibrium on a detailed
graph.
b) Suppose that income decreases to $10400. What is the new equation for the demand for tomato soup? Does
this correspond to an increase or decrease in the demand for tomato soup? Show the effect of this event on
the equilibrium and the diagram you used in part (a)
c) Start from the equilibrium in part a) and now suppose that the price of the tomato increases to $47. What is
the new equation for the supply of tomato soup? Does this correspond to an increase or decrease in supply of
tomato soup? Show the effect of this event on the equilibrium and the diagram you used in part a)?
d) Given that the changes in income and input prices are permanent, calculate the new equilibrium for the market,
i.e. Pr-S47 and Income =$10400. Show your findings on a graph.
e) Go back to part a), calculate the income elasticity of demand at equilibrium. Is tomato soup normal good for
consumers?
f) Go back to part a), calculate the price elasticity of supply at equilibrium. Is the supply elastic at the
equilibrium?
Expert Solution
This question has been solved!
Explore an expertly crafted, step-by-step solution for a thorough understanding of key concepts.

This is a popular solution!

Trending now
This is a popular solution!

Step by step
Solved in 3 steps with 3 images

Knowledge Booster


Learn more about
Need a deep-dive on the concept behind this application? Look no further. Learn more about this topic, economics and related others by exploring similar questions and additional content below.Recommended textbooks for you
Exploring Economics
Economics
ISBN:
9781544336329
Author:
Robert L. Sexton
Publisher:
SAGE Publications, Inc


Exploring Economics
Economics
ISBN:
9781544336329
Author:
Robert L. Sexton
Publisher:
SAGE Publications, Inc
