Suppose that you are given the plot below that shows the sampling distribution of Y, sample mean estimator for weights Y, for sample sizes n = (5,15, 30) out of a total population of 100. Match the line colors (or linetypes) to the Nample sizes.
Suppose that you are given the plot below that shows the sampling distribution of Y, sample mean estimator for weights Y, for sample sizes n = (5,15, 30) out of a total population of 100. Match the line colors (or linetypes) to the Nample sizes.

Chapter5: Exponential And Logarithmic Functions
Section5.5: Exponential And Logarithmic Models
Problem 3ECP: Estimate the age of a newly discovered fossil for which the ratio of carbon-14 to carbon-12 is...

Related questions
Question
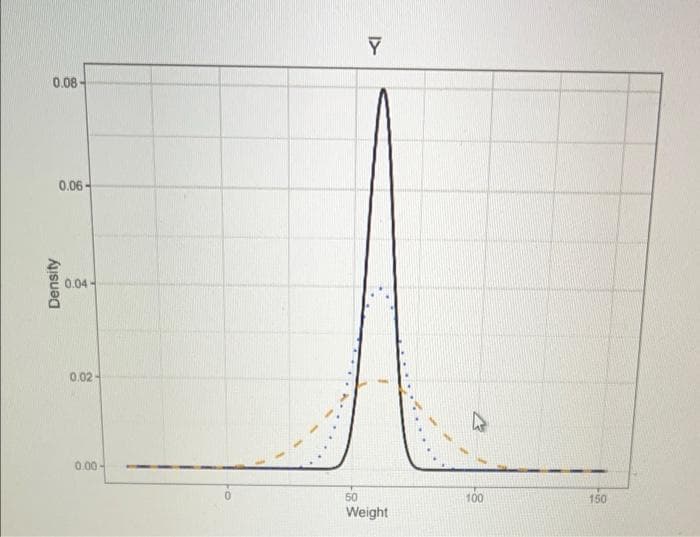
Suppose that you are given the plot below that shows the sampling distribution of Y, sample mean estimator for weights Y, for sample sizes n = (5,15, 30) out of a total population of 100. Match the line colors (or linetypes) to the Nample sizes.
Transcribed Image Text:Y
0.08-
0.06 -
0.04
0.02
0.00 -
50
100
150
Weight
Density
Expert Solution
This question has been solved!
Explore an expertly crafted, step-by-step solution for a thorough understanding of key concepts.

Step by step
Solved in 2 steps with 1 images

Recommended textbooks for you

Trigonometry (MindTap Course List)
Trigonometry
ISBN:
9781337278461
Author:
Ron Larson
Publisher:
Cengage Learning

Glencoe Algebra 1, Student Edition, 9780079039897…
Algebra
ISBN:
9780079039897
Author:
Carter
Publisher:
McGraw Hill
Trigonometry (MindTap Course List)
Trigonometry
ISBN:
9781337278461
Author:
Ron Larson
Publisher:
Cengage Learning
Glencoe Algebra 1, Student Edition, 9780079039897…
Algebra
ISBN:
9780079039897
Author:
Carter
Publisher:
McGraw Hill


Algebra & Trigonometry with Analytic Geometry
Algebra
ISBN:
9781133382119
Author:
Swokowski
Publisher:
Cengage

College Algebra (MindTap Course List)
Algebra
ISBN:
9781305652231
Author:
R. David Gustafson, Jeff Hughes
Publisher:
Cengage Learning