Suppose that you were told that average hourly wages in State A and State B are different. However, you have your own suspicion that it could be the same. You suggest to your brother, who is attending a school in State B to collect data on hourly wage as part of your project You do the same for State A as your school is located in State A. The accompanying table shows your and your brother's findings. Average Hourly Wages in State A and State B, in dollar State A State B Ystate a Sstate a | nstate A Ystate B Sstate B Nstate B 58.7 155 57.8 3.9 4.2 157 (a) Let your null hypothesis be that there is no difference in the average hourly wage in the two states. Specify the alternative hypothesis. (b) Find the difference in average hourly wage and the standard error of the difference. Generate a 95% confidence interval for the difference in average hourly wage. Calculate the t-statistic for comparing the two means. Is the difference statistically significant at the 1% level? Which critical value did you use? Why would this number be smaller if you had assumed a one-sided alternative hypothesis? What is the intuition behind (d) this? What about at 5% level? (e)
Suppose that you were told that average hourly wages in State A and State B are different. However, you have your own suspicion that it could be the same. You suggest to your brother, who is attending a school in State B to collect data on hourly wage as part of your project You do the same for State A as your school is located in State A. The accompanying table shows your and your brother's findings. Average Hourly Wages in State A and State B, in dollar State A State B Ystate a Sstate a | nstate A Ystate B Sstate B Nstate B 58.7 155 57.8 3.9 4.2 157 (a) Let your null hypothesis be that there is no difference in the average hourly wage in the two states. Specify the alternative hypothesis. (b) Find the difference in average hourly wage and the standard error of the difference. Generate a 95% confidence interval for the difference in average hourly wage. Calculate the t-statistic for comparing the two means. Is the difference statistically significant at the 1% level? Which critical value did you use? Why would this number be smaller if you had assumed a one-sided alternative hypothesis? What is the intuition behind (d) this? What about at 5% level? (e)

Glencoe Algebra 1, Student Edition, 9780079039897, 0079039898, 2018
18th Edition
ISBN:9780079039897
Author:Carter
Publisher:Carter
Chapter10: Statistics
Section: Chapter Questions
Problem 13PT

Related questions
Question
Thank you!
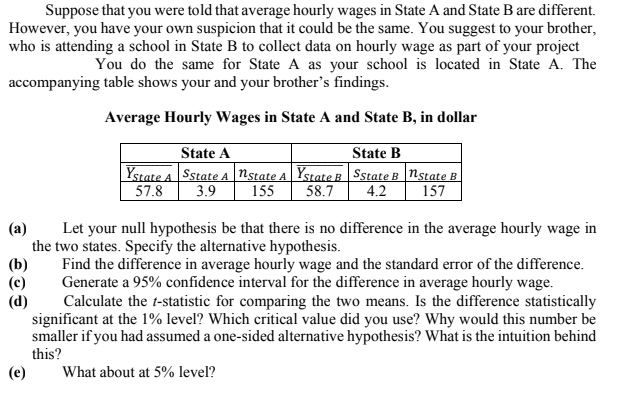
Transcribed Image Text:Suppose that you were told that average hourly wages in State A and State B are different.
However, you have your own suspicion that it could be the same. You suggest to your brother,
who is attending a school in State B to collect data on hourly wage as part of your project
You do the same for State A as your school is located in State A. The
accompanying table shows your and your brother's findings.
Average Hourly Wages in State A and State B, in dollar
State A
State B
Ystate A Sstate A Nstate A Ystate B Sstate B Nstate B
57.8
3.9
155
58.7
4.2
157
(a)
Let your null hypothesis be that there is no difference in the average hourly wage in
the two states. Specify the alternative hypothesis.
(b)
Find the difference in average hourly wage and the standard error of the difference.
(c)
Generate a 95% confidence interval for the difference in average hourly wage.
(d)
Calculate the t-statistic for comparing the two means. Is the difference statistically
significant at the 1% level? Which critical value did you use? Why would this number be
smaller if you had assumed a one-sided alternative hypothesis? What is the intuition behind
this?
(e)
What about at 5% level?
Expert Solution
This question has been solved!
Explore an expertly crafted, step-by-step solution for a thorough understanding of key concepts.

This is a popular solution!

Trending now
This is a popular solution!

Step by step
Solved in 4 steps with 4 images

Recommended textbooks for you
Glencoe Algebra 1, Student Edition, 9780079039897…
Algebra
ISBN:
9780079039897
Author:
Carter
Publisher:
McGraw Hill
Glencoe Algebra 1, Student Edition, 9780079039897…
Algebra
ISBN:
9780079039897
Author:
Carter
Publisher:
McGraw Hill