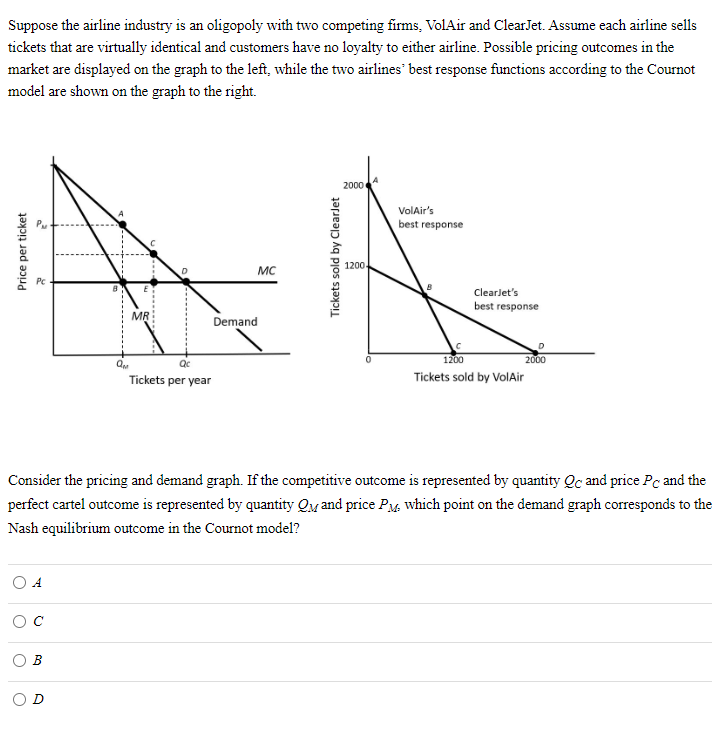
Suppose the airline industry is an oligopoly with two competing firms, VolAir and ClearJet. Assume each airline sells tickets that are virtually identical and customers have no loyalty to either airline. Possible pricing outcomes in the market are displayed on the graph to the left, while the two airlines' best response functions according to the Cournot model are shown on the graph to the right. Price per ticket 2 MR MC Demand 2000 VolAir's best response A 1200 Tickets sold by Clearjet Clearlet's best response
Suppose the airline industry is an oligopoly with two competing firms, VolAir and ClearJet. Assume each airline sells tickets that are virtually identical and customers have no loyalty to either airline. Possible pricing outcomes in the market are displayed on the graph to the left, while the two airlines' best response functions according to the Cournot model are shown on the graph to the right. Price per ticket 2 MR MC Demand 2000 VolAir's best response A 1200 Tickets sold by Clearjet Clearlet's best response

Managerial Economics: Applications, Strategies and Tactics (MindTap Course List)
14th Edition
ISBN:9781305506381
Author:James R. McGuigan, R. Charles Moyer, Frederick H.deB. Harris
Publisher:James R. McGuigan, R. Charles Moyer, Frederick H.deB. Harris
Chapter12: Price And Output Determination: Oligopoly
Section: Chapter Questions
Problem 1E

Related questions
Question
Transcribed Image Text:Suppose the airline industry is an oligopoly with two competing firms, VolAir and ClearJet. Assume each airline sells
tickets that are virtually identical and customers have no loyalty to either airline. Possible pricing outcomes in the
market are displayed on the graph to the left, while the two airlines' best response functions according to the Cournot
model are shown on the graph to the right.
Price per ticket
O
A
с
by
B
Qu
A
MR
Tickets per year
MC
Demand
Tickets sold by Clearlet
2000
1200
Consider the pricing and demand graph. If the competitive outcome is represented by quantity Qc and price Pc and the
perfect cartel outcome is represented by quantity Q and price PM, which point on the demand graph corresponds to the
Nash equilibrium outcome in the Cournot model?
0
VolAir's
best response
ClearJet's
best response
1200
Tickets sold by VolAir
D
2000
Expert Solution
This question has been solved!
Explore an expertly crafted, step-by-step solution for a thorough understanding of key concepts.

This is a popular solution!

Trending now
This is a popular solution!

Step by step
Solved in 3 steps

Knowledge Booster


Learn more about
Need a deep-dive on the concept behind this application? Look no further. Learn more about this topic, economics and related others by exploring similar questions and additional content below.Recommended textbooks for you
Managerial Economics: Applications, Strategies an…
Economics
ISBN:
9781305506381
Author:
James R. McGuigan, R. Charles Moyer, Frederick H.deB. Harris
Publisher:
Cengage Learning

Managerial Economics: Applications, Strategies an…
Economics
ISBN:
9781305506381
Author:
James R. McGuigan, R. Charles Moyer, Frederick H.deB. Harris
Publisher:
Cengage Learning

Managerial Economics: A Problem Solving Approach
Economics
ISBN:
9781337106665
Author:
Luke M. Froeb, Brian T. McCann, Michael R. Ward, Mike Shor
Publisher:
Cengage Learning


Exploring Economics
Economics
ISBN:
9781544336329
Author:
Robert L. Sexton
Publisher:
SAGE Publications, Inc