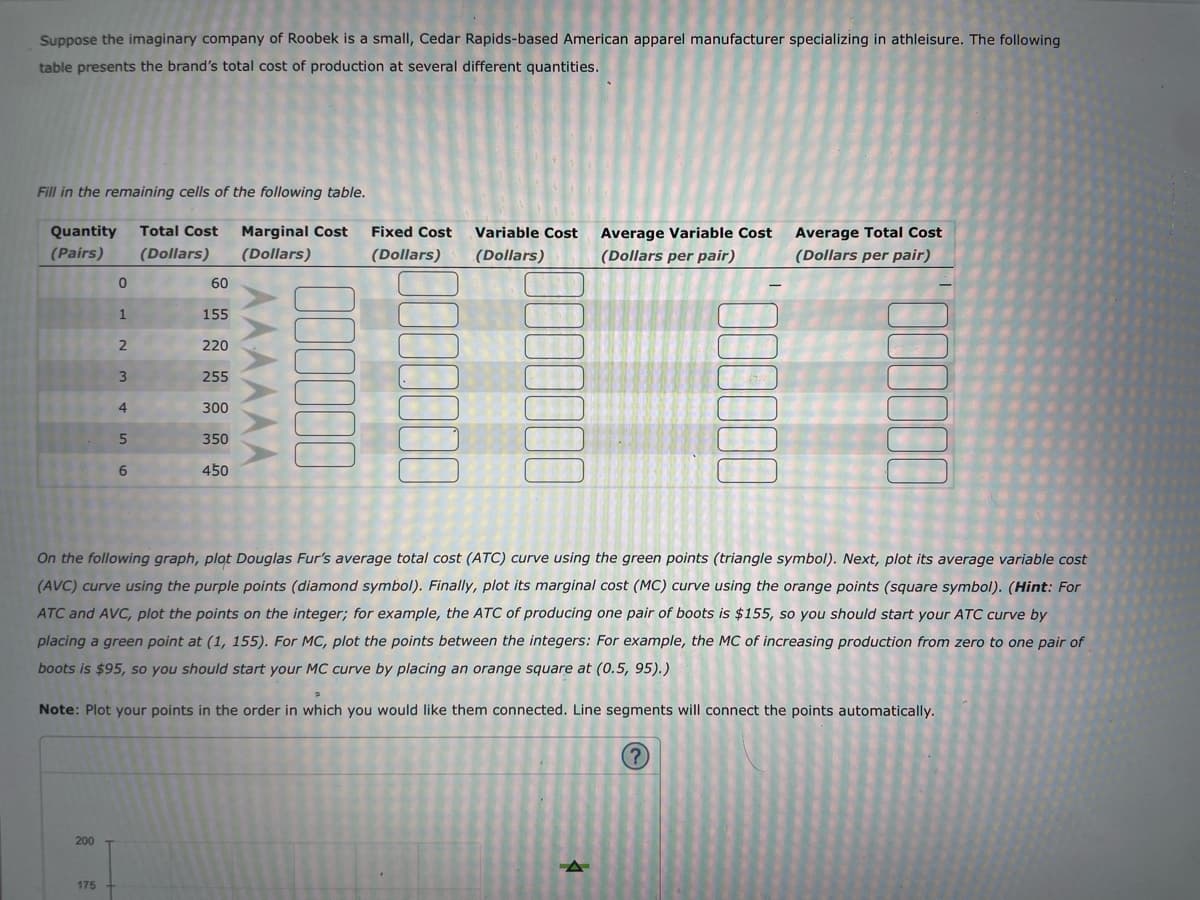
Suppose the imaginary company of Roobek is a small, Cedar Rapids-based American apparel manufacturer specializing in athleisure. The following table presents the brand's total cost of production at several different quantities. Fill in the remaining cells of the following table. Quantity Total Cost Marginal Cost (Pairs) (Dollars) (Dollars) 0 200 1 2 3 4 5 6 60 155 220 255 300 350 450 Fixed Cost (Dollars) Variable Cost (Dollars) Average Variable Cost (Dollars per pair) 000000 On the following graph, plot Douglas Fur's average total cost (ATC) curve using the green points (triangle symbol). Next, plot its average variable cost (AVC) curve using the purple points (diamond symbol). Finally, plot its marginal cost (MC) curve using the orange points (square symbol). (Hint: For ATC and AVC, plot the points on the integer; for example, the ATC of producing one pair of boots is $155, so you should start your ATC curve by placing a green point at (1, 155). For MC, plot the points between the integers: For example, the MC of increasing production from zero to one pair of boots is $95, so you should start your MC curve by placing an orange square at (0.5, 95).) Note: Plot your points in the order in which you would like them connected. Line segments will connect the points automatically. (?) Average Total Cost (Dollars per pair)
Suppose the imaginary company of Roobek is a small, Cedar Rapids-based American apparel manufacturer specializing in athleisure. The following table presents the brand's total cost of production at several different quantities. Fill in the remaining cells of the following table. Quantity Total Cost Marginal Cost (Pairs) (Dollars) (Dollars) 0 200 1 2 3 4 5 6 60 155 220 255 300 350 450 Fixed Cost (Dollars) Variable Cost (Dollars) Average Variable Cost (Dollars per pair) 000000 On the following graph, plot Douglas Fur's average total cost (ATC) curve using the green points (triangle symbol). Next, plot its average variable cost (AVC) curve using the purple points (diamond symbol). Finally, plot its marginal cost (MC) curve using the orange points (square symbol). (Hint: For ATC and AVC, plot the points on the integer; for example, the ATC of producing one pair of boots is $155, so you should start your ATC curve by placing a green point at (1, 155). For MC, plot the points between the integers: For example, the MC of increasing production from zero to one pair of boots is $95, so you should start your MC curve by placing an orange square at (0.5, 95).) Note: Plot your points in the order in which you would like them connected. Line segments will connect the points automatically. (?) Average Total Cost (Dollars per pair)

Managerial Economics: Applications, Strategies and Tactics (MindTap Course List)
14th Edition
ISBN:9781305506381
Author:James R. McGuigan, R. Charles Moyer, Frederick H.deB. Harris
Publisher:James R. McGuigan, R. Charles Moyer, Frederick H.deB. Harris
Chapter11: Price And Output Determination: Monopoly And Dominant Firms
Section: Chapter Questions
Problem 6E

Related questions

Question
Please solve
Transcribed Image Text:Suppose the imaginary company of Roobek is a small, Cedar Rapids-based American apparel manufacturer specializing in athleisure. The following
table presents the brand's total cost of production at several different quantities.
Fill in the remaining cells of the following table.
Quantity Total Cost Marginal Cost
(Pairs) (Dollars) (Dollars)
200
0
1
175
NM+S6
2
3
4
5
60
155
220
255
300
350
450
AAAAA
Fixed Cost
(Dollars)
Variable Cost
(Dollars)
Average Variable Cost
(Dollars per pair)
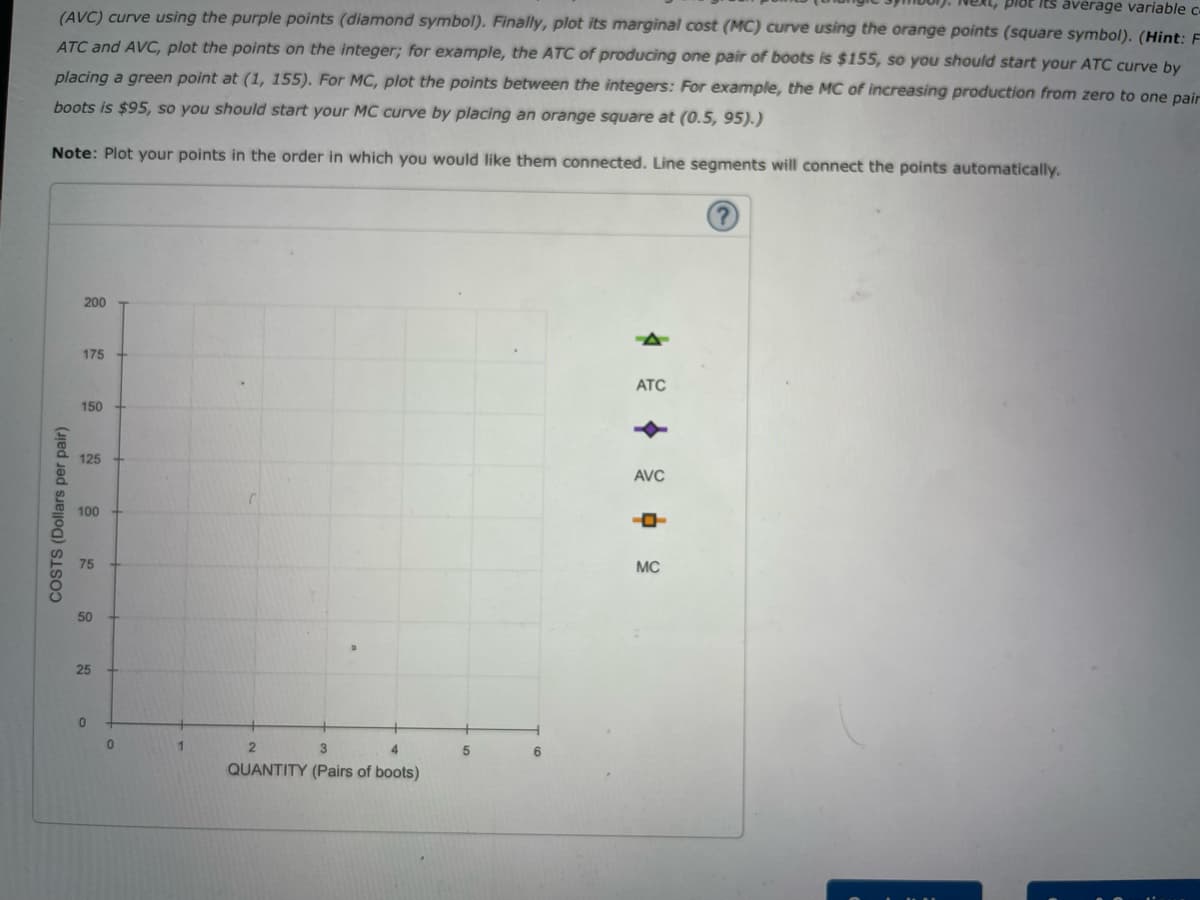
On the following graph, plot Douglas Fur's average total cost (ATC) curve using the green points (triangle symbol). Next, plot its average variable cost
(AVC) curve using the purple points (diamond symbol). Finally, plot its marginal cost (MC) curve using the orange points (square symbol). (Hint: For
ATC and AVC, plot the points on the integer; for example, the ATC of producing one pair of boots is $155, so you should start your ATC curve by
placing a green point at (1, 155). For MC, plot the points between the integers: For example, the MC of increasing production from zero to one pair of
boots is $95, so you should start your MC curve by placing an orange square at (0.5, 95).)
Note: Plot your points in the order in which you would like them connected. Line segments will connect the points automatically.
Average Total Cost
(Dollars per pair)
Transcribed Image Text:ext, plot its average variable c
(AVC) curve using the purple points (diamond symbol). Finally, plot its marginal cost (MC) curve using the orange points (square symbol). (Hint: F
ATC and AVC, plot the points on the integer; for example, the ATC of producing one pair of boots is $155, so you should start your ATC curve by
placing a green point at (1, 155). For MC, plot the points between the integers: For example, the MC of increasing production from zero to one pair
boots is $95, so you should start your MC curve by placing an orange square at (0.5, 95).)
Note: Plot your points in the order in which you would like them connected. Line segments will connect the points automatically.
COSTS (Dollars per pair)
200
175
150
125
100
75
50
25
0
0
1
2
3
4
QUANTITY (Pairs of boots)
5
6
ATC
AVC
MC
Expert Solution
This question has been solved!
Explore an expertly crafted, step-by-step solution for a thorough understanding of key concepts.

This is a popular solution!

Trending now
This is a popular solution!

Step by step
Solved in 3 steps with 1 images

Knowledge Booster


Learn more about
Need a deep-dive on the concept behind this application? Look no further. Learn more about this topic, economics and related others by exploring similar questions and additional content below.Recommended textbooks for you
Managerial Economics: Applications, Strategies an…
Economics
ISBN:
9781305506381
Author:
James R. McGuigan, R. Charles Moyer, Frederick H.deB. Harris
Publisher:
Cengage Learning

Principles of Economics (MindTap Course List)
Economics
ISBN:
9781305585126
Author:
N. Gregory Mankiw
Publisher:
Cengage Learning

Principles of Economics, 7th Edition (MindTap Cou…
Economics
ISBN:
9781285165875
Author:
N. Gregory Mankiw
Publisher:
Cengage Learning
Managerial Economics: Applications, Strategies an…
Economics
ISBN:
9781305506381
Author:
James R. McGuigan, R. Charles Moyer, Frederick H.deB. Harris
Publisher:
Cengage Learning
Principles of Economics (MindTap Course List)
Economics
ISBN:
9781305585126
Author:
N. Gregory Mankiw
Publisher:
Cengage Learning
Principles of Economics, 7th Edition (MindTap Cou…
Economics
ISBN:
9781285165875
Author:
N. Gregory Mankiw
Publisher:
Cengage Learning

Essentials of Economics (MindTap Course List)
Economics
ISBN:
9781337091992
Author:
N. Gregory Mankiw
Publisher:
Cengage Learning


Managerial Economics: A Problem Solving Approach
Economics
ISBN:
9781337106665
Author:
Luke M. Froeb, Brian T. McCann, Michael R. Ward, Mike Shor
Publisher:
Cengage Learning