Suppose the price of beans is increased. Which of the following statements is true? Select one: O a. Vanessa's budget line will pivot outwards along the axis representing broccoli O b. Vanessa's budget line shift inwards O. Vanessa's budget line will pivot inwards along the axis representing beans O d. Vanessa's indifference curve will shift inwards
Suppose the price of beans is increased. Which of the following statements is true? Select one: O a. Vanessa's budget line will pivot outwards along the axis representing broccoli O b. Vanessa's budget line shift inwards O. Vanessa's budget line will pivot inwards along the axis representing beans O d. Vanessa's indifference curve will shift inwards

Principles of Economics 2e
2nd Edition
ISBN:9781947172364
Author:Steven A. Greenlaw; David Shapiro
Publisher:Steven A. Greenlaw; David Shapiro
Chapter2: Choice In A World Of Scarcity
Section: Chapter Questions
Problem 2SCQ: Return to the example in Figure 2.4. Suppose there is an improvement in medical technology that...

Related questions
Question
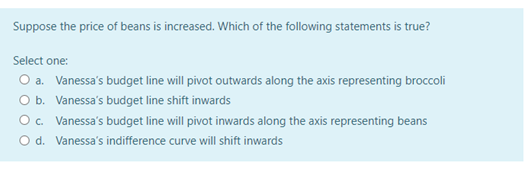
Transcribed Image Text:Suppose the price of beans is increased. Which of the following statements is true?
Select one:
O a. Vanessa's budget line will pivot outwards along the axis representing broccoli
O b. Vanessa's budget line shift inwards
Oc. Vanessa's budget line will pivot inwards along the axis representing beans
O d. Vanessa's indifference curve will shift inwards
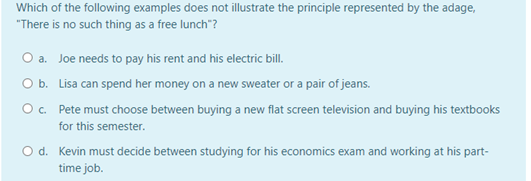
Transcribed Image Text:Which of the following examples does not illustrate the principle represented by the adage,
"There is no such thing as a free lunch"?
O a. Joe needs to pay his rent and his electric bill.
O b. Lisa can spend her money on a new sweater or a pair of jeans.
Oc. Pete must choose between buying a new flat screen television and buying his textbooks
for this semester.
O d. Kevin must decide between studying for his economics exam and working at his part-
time job.
Expert Solution
This question has been solved!
Explore an expertly crafted, step-by-step solution for a thorough understanding of key concepts.

Step by step
Solved in 3 steps

Recommended textbooks for you
Principles of Economics 2e
Economics
ISBN:
9781947172364
Author:
Steven A. Greenlaw; David Shapiro
Publisher:
OpenStax

Essentials of Economics (MindTap Course List)
Economics
ISBN:
9781337091992
Author:
N. Gregory Mankiw
Publisher:
Cengage Learning

Brief Principles of Macroeconomics (MindTap Cours…
Economics
ISBN:
9781337091985
Author:
N. Gregory Mankiw
Publisher:
Cengage Learning
Principles of Economics 2e
Economics
ISBN:
9781947172364
Author:
Steven A. Greenlaw; David Shapiro
Publisher:
OpenStax
Essentials of Economics (MindTap Course List)
Economics
ISBN:
9781337091992
Author:
N. Gregory Mankiw
Publisher:
Cengage Learning
Brief Principles of Macroeconomics (MindTap Cours…
Economics
ISBN:
9781337091985
Author:
N. Gregory Mankiw
Publisher:
Cengage Learning


Economics (MindTap Course List)
Economics
ISBN:
9781337617383
Author:
Roger A. Arnold
Publisher:
Cengage Learning
