Suppose we randomly sample 8 people in Grade 9 and record their final average. We follow up with the same 8 people one year later, and record their Grade 10 final average. The results are presented. Final Average Grade 9 76 73 66 95 75 78 96 93 Grade 10 75 80 70 93 81 90 88 79 We want to test whether the grades have improved for these 8 people between Grade 9 and Grade 10. What is the observed value of the test statistic corresponding to the appropriate hypothesis test? What is the p-value corresponding to the observed value of the test statistic you computed? Give answer to 3 decimal places. Based on the p-value, there is no indication that the final average has improved from Grade 9 to Grade 10. Select one: O True O False
Suppose we randomly sample 8 people in Grade 9 and record their final average. We follow up with the same 8 people one year later, and record their Grade 10 final average. The results are presented. Final Average Grade 9 76 73 66 95 75 78 96 93 Grade 10 75 80 70 93 81 90 88 79 We want to test whether the grades have improved for these 8 people between Grade 9 and Grade 10. What is the observed value of the test statistic corresponding to the appropriate hypothesis test? What is the p-value corresponding to the observed value of the test statistic you computed? Give answer to 3 decimal places. Based on the p-value, there is no indication that the final average has improved from Grade 9 to Grade 10. Select one: O True O False

Holt Mcdougal Larson Pre-algebra: Student Edition 2012
1st Edition
ISBN:9780547587776
Author:HOLT MCDOUGAL
Publisher:HOLT MCDOUGAL
Chapter11: Data Analysis And Probability
Section: Chapter Questions
Problem 8CR

Related questions
Question
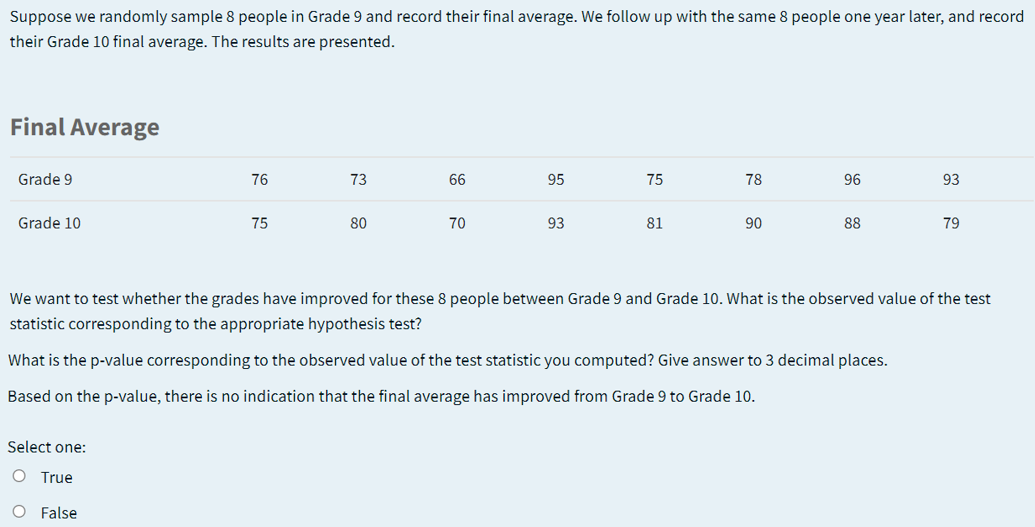
Transcribed Image Text:Suppose we randomly sample 8 people in Grade 9 and record their final average. We follow up with the same 8 people one year later, and record
their Grade 10 final average. The results are presented.
Final Average
Grade 9
76
73
66
95
75
78
96
93
Grade 10
75
80
70
93
81
90
88
79
We want to test whether the grades have improved for these 8 people between Grade 9 and Grade 10. What is the observed value of the test
statistic corresponding to the appropriate hypothesis test?
What is the p-value corresponding to the observed value of the test statistic you computed? Give answer to 3 decimal places.
Based on the p-value, there is no indication that the final average has improved from Grade 9 to Grade 10.
Select one:
O True
O False
Expert Solution
This question has been solved!
Explore an expertly crafted, step-by-step solution for a thorough understanding of key concepts.

Step by step
Solved in 2 steps with 2 images

Recommended textbooks for you
Holt Mcdougal Larson Pre-algebra: Student Edition…
Algebra
ISBN:
9780547587776
Author:
HOLT MCDOUGAL
Publisher:
HOLT MCDOUGAL

College Algebra (MindTap Course List)
Algebra
ISBN:
9781305652231
Author:
R. David Gustafson, Jeff Hughes
Publisher:
Cengage Learning
Holt Mcdougal Larson Pre-algebra: Student Edition…
Algebra
ISBN:
9780547587776
Author:
HOLT MCDOUGAL
Publisher:
HOLT MCDOUGAL
College Algebra (MindTap Course List)
Algebra
ISBN:
9781305652231
Author:
R. David Gustafson, Jeff Hughes
Publisher:
Cengage Learning