Classify the conclusion of the hypothesis test as a Type I error, a Type II error, or a correct decision. In 1995, the average math SAT score for students at one school was 486. Five years later, a teacher wants to perform a hypothesis test to determine whether the average math SAT score of students at the school has changed from the 1995 mean of 486. The hypotheses are: H,u=486 Hu#486 Suppose that the results of the sampling lead to rejection of the null hypothesis. Classify that conclusion as a Type I error, a Type II error, or a correct decision, if in fact 1006
Classify the conclusion of the hypothesis test as a Type I error, a Type II error, or a correct decision. In 1995, the average math SAT score for students at one school was 486. Five years later, a teacher wants to perform a hypothesis test to determine whether the average math SAT score of students at the school has changed from the 1995 mean of 486. The hypotheses are: H,u=486 Hu#486 Suppose that the results of the sampling lead to rejection of the null hypothesis. Classify that conclusion as a Type I error, a Type II error, or a correct decision, if in fact 1006

Holt Mcdougal Larson Pre-algebra: Student Edition 2012
1st Edition
ISBN:9780547587776
Author:HOLT MCDOUGAL
Publisher:HOLT MCDOUGAL
Chapter11: Data Analysis And Probability
Section: Chapter Questions
Problem 8CR

Related questions
Question
100%
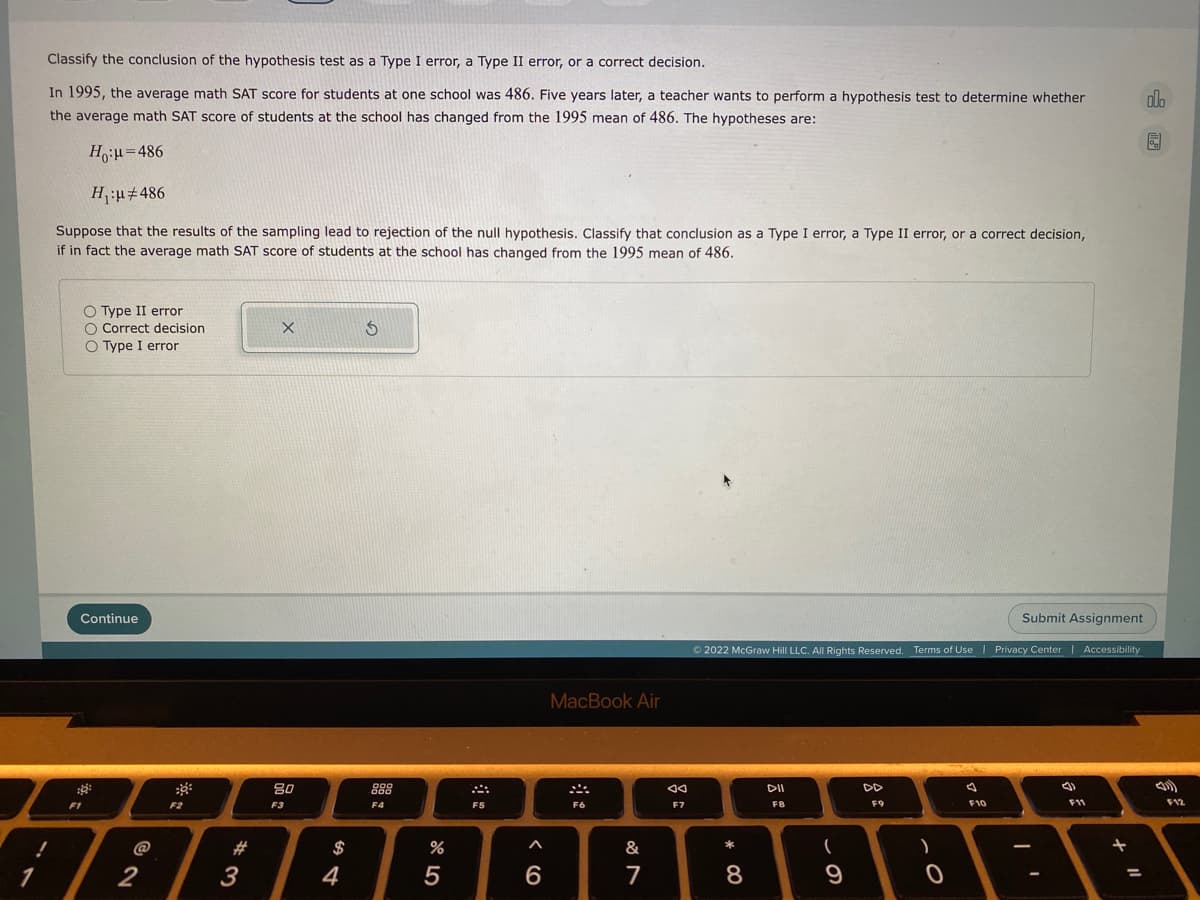
Transcribed Image Text:Classify the conclusion of the hypothesis test as a Type I error, a Type II error, or a correct decision.
In 1995, the average math SAT score for students at one school was 486. Five years later, a teacher wants to perform a hypothesis test to determine whether
olo
the average math SAT score of students at the school has changed from the 1995 mean of 486. The hypotheses are:
H,:u=486
Hu#486
Suppose that the results of the sampling lead to rejection of the null hypothesis. Classify that conclusion as a Type I error, a Type II error, or a correct decision,
if in fact the average math SAT score of students at the school has changed from the 1995 mean of 486.
O Type II error
O Correct decision
O Type I error
Continue
Submit Assignment
O 2022 McGraw Hill LLC. All Rights Reserved. Terms of Use
Privacy Center Accessibility
MacBook Air
80
888
DD
F1
F2
F3
F4
F5
F6
F7
FB
F9
F10
F11
F12
#3
3
@
$
&
*
1
2
4
5
8
9
%3D
Expert Solution
This question has been solved!
Explore an expertly crafted, step-by-step solution for a thorough understanding of key concepts.

This is a popular solution!

Trending now
This is a popular solution!

Step by step
Solved in 2 steps

Recommended textbooks for you
Holt Mcdougal Larson Pre-algebra: Student Edition…
Algebra
ISBN:
9780547587776
Author:
HOLT MCDOUGAL
Publisher:
HOLT MCDOUGAL


College Algebra (MindTap Course List)
Algebra
ISBN:
9781305652231
Author:
R. David Gustafson, Jeff Hughes
Publisher:
Cengage Learning
Holt Mcdougal Larson Pre-algebra: Student Edition…
Algebra
ISBN:
9780547587776
Author:
HOLT MCDOUGAL
Publisher:
HOLT MCDOUGAL
College Algebra (MindTap Course List)
Algebra
ISBN:
9781305652231
Author:
R. David Gustafson, Jeff Hughes
Publisher:
Cengage Learning