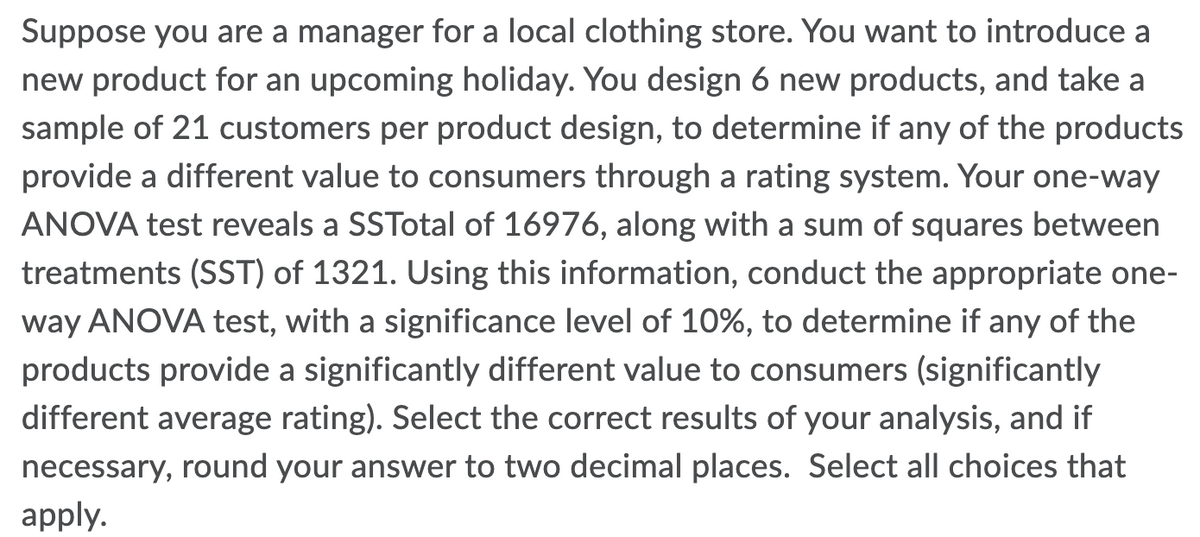
Suppose you are a manager for a local clothing store. You want to introduce a new product for an upcoming holiday. You design 6 new products, and take a sample of 21 customers per product design, to determine if any of the products provide a different value to consumers through a rating system. Your one-way ANOVA test reveals a SSTotal of 16976, along with a sum of squares between treatments (SST) of 1321. Using this information, conduct the appropriate one- way ANOVA test, with a significance level of 10%, to determine if any of the products provide a significantly different value to consumers (significantly different average rating). Select the correct results of your analysis, and if necessary, round your answer to two decimal places. Select all choices that apply
Suppose you are a manager for a local clothing store. You want to introduce a new product for an upcoming holiday. You design 6 new products, and take a sample of 21 customers per product design, to determine if any of the products provide a different value to consumers through a rating system. Your one-way ANOVA test reveals a SSTotal of 16976, along with a sum of squares between treatments (SST) of 1321. Using this information, conduct the appropriate one- way ANOVA test, with a significance level of 10%, to determine if any of the products provide a significantly different value to consumers (significantly different average rating). Select the correct results of your analysis, and if necessary, round your answer to two decimal places. Select all choices that apply

Algebra & Trigonometry with Analytic Geometry
13th Edition
ISBN:9781133382119
Author:Swokowski
Publisher:Swokowski
Chapter10: Sequences, Series, And Probability
Section10.8: Probability
Problem 32E

Related questions
Question
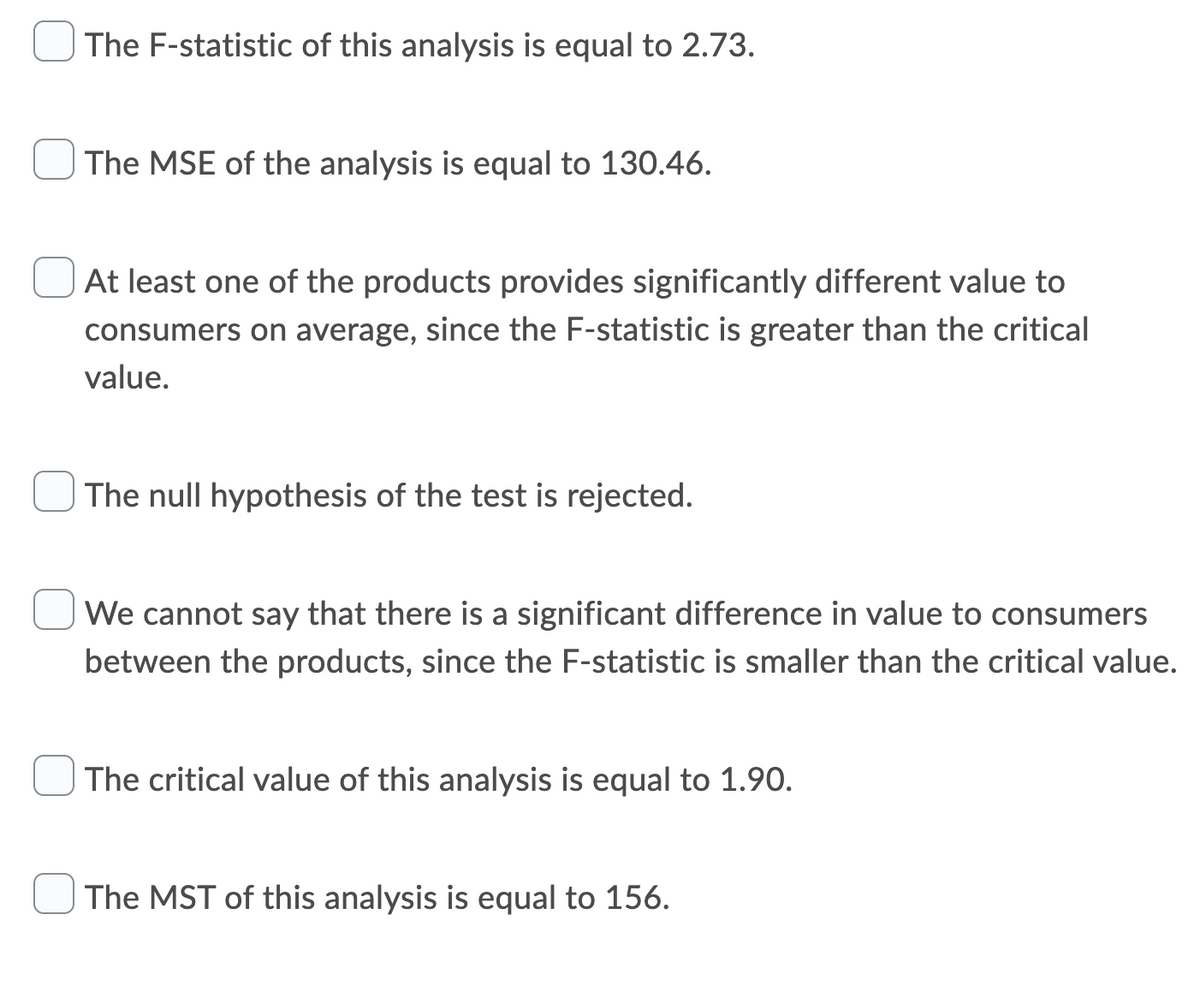
Transcribed Image Text:The F-statistic of this analysis is equal to 2.73.
The MSE of the analysis is equal to 130.46.
At least one of the products provides significantly different value to
consumers on average, since the F-statistic is greater than the critical
value.
The null hypothesis of the test is rejected.
We cannot say that there is a significant difference in value to consumers
between the products, since the F-statistic is smaller than the critical value.
The critical value of this analysis is equal to 1.90.
The MST of this analysis is equal to 156.
Transcribed Image Text:Suppose you are a manager for a local clothing store. You want to introduce a
new product for an upcoming holiday. You design 6 new products, and take a
sample of 21 customers per product design, to determine if any of the products
provide a different value to consumers through a rating system. Your one-way
ANOVA test reveals a SSTotal of 16976, along with a sum of squares between
treatments (SST) of 1321. Using this information, conduct the appropriate one-
way ANOVA test, with a significance level of 10%, to determine if any of the
products provide a significantly different value to consumers (significantly
different average rating). Select the correct results of your analysis, and if
necessary, round your answer to two decimal places. Select all choices that
apply.
Expert Solution
This question has been solved!
Explore an expertly crafted, step-by-step solution for a thorough understanding of key concepts.

Step by step
Solved in 3 steps with 1 images

Recommended textbooks for you
Algebra & Trigonometry with Analytic Geometry
Algebra
ISBN:
9781133382119
Author:
Swokowski
Publisher:
Cengage

Holt Mcdougal Larson Pre-algebra: Student Edition…
Algebra
ISBN:
9780547587776
Author:
HOLT MCDOUGAL
Publisher:
HOLT MCDOUGAL
Algebra & Trigonometry with Analytic Geometry
Algebra
ISBN:
9781133382119
Author:
Swokowski
Publisher:
Cengage
Holt Mcdougal Larson Pre-algebra: Student Edition…
Algebra
ISBN:
9780547587776
Author:
HOLT MCDOUGAL
Publisher:
HOLT MCDOUGAL