Suppose you wish to predict future values of some quantity, y, using an autonomous differential equation. Experiments have been performed that give the following information: • The only equilibrium solutions are y(t) = 0, y(t) = 15, and y(t) = 60 • If the value of y is 100, the quantity decreases • If the value of y is 30, the quantity increases • If the value of y is negative, the quantity increases %3D (a) How many different phase lines match the above? Sketch all possible phase lines. (b) Provide a rough sketch of an autonomous derivative graph for each of your phase lines in part 2a. (c) For each of your different sketches in part 2b, develop a differential equation that fits the basic features.
Suppose you wish to predict future values of some quantity, y, using an autonomous differential equation. Experiments have been performed that give the following information: • The only equilibrium solutions are y(t) = 0, y(t) = 15, and y(t) = 60 • If the value of y is 100, the quantity decreases • If the value of y is 30, the quantity increases • If the value of y is negative, the quantity increases %3D (a) How many different phase lines match the above? Sketch all possible phase lines. (b) Provide a rough sketch of an autonomous derivative graph for each of your phase lines in part 2a. (c) For each of your different sketches in part 2b, develop a differential equation that fits the basic features.

Advanced Engineering Mathematics
10th Edition
ISBN:9780470458365
Author:Erwin Kreyszig
Publisher:Erwin Kreyszig
Chapter2: Second-order Linear Odes
Section: Chapter Questions
Problem 1RQ

Related questions
Question
Answer all parts please. also for part A can you make sure its phase lines
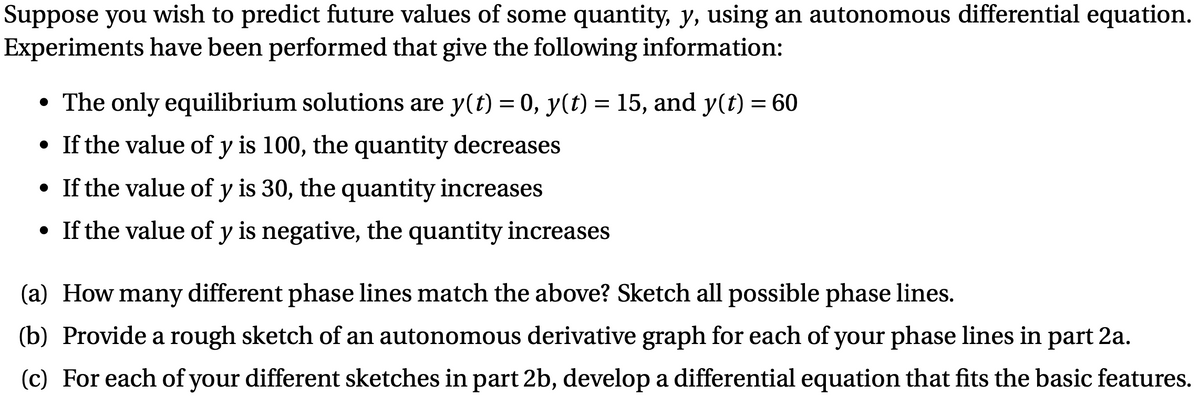
Transcribed Image Text:Suppose you wish to predict future values of some quantity, y, using an autonomous differential equation.
Experiments have been performed that give the following information:
• The only equilibrium solutions are y(t) = 0, y(t) = 15, and y(t) = 60
• If the value of y is 100, the quantity decreases
• If the value of y is 30, the quantity increases
• If the value of y is negative, the quantity increases
(a) How many different phase lines match the above? Sketch all possible phase lines.
(b) Provide a rough sketch of an autonomous derivative graph for each of your phase lines in part 2a.
(c) For each of your different sketches in part 2b, develop a differential equation that fits the basic features.
Expert Solution
This question has been solved!
Explore an expertly crafted, step-by-step solution for a thorough understanding of key concepts.

This is a popular solution!

Trending now
This is a popular solution!

Step by step
Solved in 4 steps with 1 images

Recommended textbooks for you
Advanced Engineering Mathematics
Advanced Math
ISBN:
9780470458365
Author:
Erwin Kreyszig
Publisher:
Wiley, John & Sons, Incorporated

Numerical Methods for Engineers
Advanced Math
ISBN:
9780073397924
Author:
Steven C. Chapra Dr., Raymond P. Canale
Publisher:
McGraw-Hill Education

Introductory Mathematics for Engineering Applicat…
Advanced Math
ISBN:
9781118141809
Author:
Nathan Klingbeil
Publisher:
WILEY
Advanced Engineering Mathematics
Advanced Math
ISBN:
9780470458365
Author:
Erwin Kreyszig
Publisher:
Wiley, John & Sons, Incorporated
Numerical Methods for Engineers
Advanced Math
ISBN:
9780073397924
Author:
Steven C. Chapra Dr., Raymond P. Canale
Publisher:
McGraw-Hill Education
Introductory Mathematics for Engineering Applicat…
Advanced Math
ISBN:
9781118141809
Author:
Nathan Klingbeil
Publisher:
WILEY

Mathematics For Machine Technology
Advanced Math
ISBN:
9781337798310
Author:
Peterson, John.
Publisher:
Cengage Learning,

