Susan owns a restaurant that sells hamburgers in a monopolistically competitive market. The graph to the right depicts the demand and marginal revenue for her hamburgers. Suppose that Susan's restaurant is maximizing profits at 35 hamburgers (per day). Assume that the monopolistically competitive industry is at a long-run equilibrium. Use the three-point curve drawing tool to add Susan's long run average cost (ATC) curve to the graph. Properly label this curve. Carefully follow the instructions above, and only draw the required objects. Price and cost (dollars per hambu 2.00 2.25- 2.00- 1.75 1.50 1.25- 1.00 0.75- 0.50 0.25 ATC MR D 0 60 70 80 90 100 10 20 30 40 50 Quantity of hamburgers (per day) O
Susan owns a restaurant that sells hamburgers in a monopolistically competitive market. The graph to the right depicts the demand and marginal revenue for her hamburgers. Suppose that Susan's restaurant is maximizing profits at 35 hamburgers (per day). Assume that the monopolistically competitive industry is at a long-run equilibrium. Use the three-point curve drawing tool to add Susan's long run average cost (ATC) curve to the graph. Properly label this curve. Carefully follow the instructions above, and only draw the required objects. Price and cost (dollars per hambu 2.00 2.25- 2.00- 1.75 1.50 1.25- 1.00 0.75- 0.50 0.25 ATC MR D 0 60 70 80 90 100 10 20 30 40 50 Quantity of hamburgers (per day) O

Chapter14: Monopolistic Competition And Product Differentiation
Section: Chapter Questions
Problem 5P

Related questions
Question
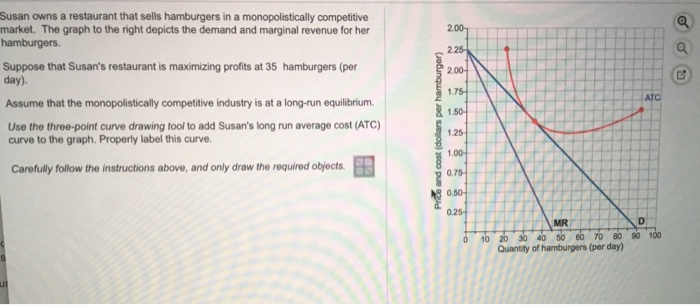
Transcribed Image Text:Susan owns a restaurant that sells hamburgers in a monopolistically competitive
market. The graph to the right depicts the demand and marginal revenue for her
hamburgers.
Suppose that Susan's restaurant is maximizing profits at 35 hamburgers (per
day).
Assume that the monopolistically competitive industry is at a long-run equilibrium.
Use the three-point curve drawing tool to add Susan's long run average cost (ATC)
curve to the graph. Properly label this curve.
Carefully follow the instructions above, and only draw the required objects.
ul
Price and cost (dollars per hamburger)
2.00-
2.25-
2.00-
1.75
1.50-
1.25
1.00-
0.75-
0.50
0.25
0
MR
10 20 30 40 50 60 70 80
Quantity of hamburgers (per day)
ATC
D
90 100
a
G
Expert Solution
This question has been solved!
Explore an expertly crafted, step-by-step solution for a thorough understanding of key concepts.

This is a popular solution!

Trending now
This is a popular solution!

Step by step
Solved in 3 steps with 1 images

Knowledge Booster


Learn more about
Need a deep-dive on the concept behind this application? Look no further. Learn more about this topic, economics and related others by exploring similar questions and additional content below.Recommended textbooks for you
Exploring Economics
Economics
ISBN:
9781544336329
Author:
Robert L. Sexton
Publisher:
SAGE Publications, Inc


Exploring Economics
Economics
ISBN:
9781544336329
Author:
Robert L. Sexton
Publisher:
SAGE Publications, Inc


Managerial Economics: A Problem Solving Approach
Economics
ISBN:
9781337106665
Author:
Luke M. Froeb, Brian T. McCann, Michael R. Ward, Mike Shor
Publisher:
Cengage Learning