SVerweight. To test her claim, a random sample of 20 Europeans was weighted, and the difference between their actual and ideal weights was calculated. The data and summary statistics are listed here. Do these data allow us to infer at the 5% significance level that the professor's claim is true? (Assume the population is normally distributed) Data: 16, 23, 18, 41, 22, 18, 23, 19, 22, 15, 18, 35, 16, 15, 17, 19, 23, 15, 16, 26 Sample mean = 20.85 Sample variance = 45.713
SVerweight. To test her claim, a random sample of 20 Europeans was weighted, and the difference between their actual and ideal weights was calculated. The data and summary statistics are listed here. Do these data allow us to infer at the 5% significance level that the professor's claim is true? (Assume the population is normally distributed) Data: 16, 23, 18, 41, 22, 18, 23, 19, 22, 15, 18, 35, 16, 15, 17, 19, 23, 15, 16, 26 Sample mean = 20.85 Sample variance = 45.713

Glencoe Algebra 1, Student Edition, 9780079039897, 0079039898, 2018
18th Edition
ISBN:9780079039897
Author:Carter
Publisher:Carter
Chapter10: Statistics
Section10.3: Measures Of Spread
Problem 1GP

Related questions
Topic Video
Question
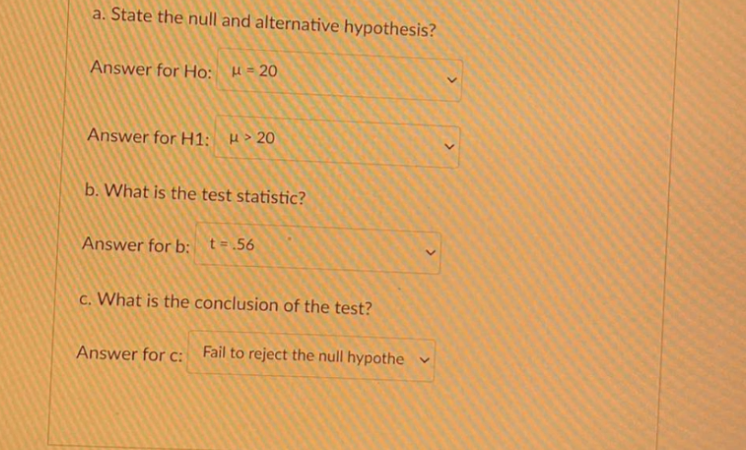
Transcribed Image Text:a. State the null and alternative hypothesis?
Answer for Ho: H= 20
Answer for H1; H> 20
b. What is the test statistic?
Answer for b: t=.56
c. What is the conclusion of the test?
Answer for c: Fail to reject the null hypothe v
>
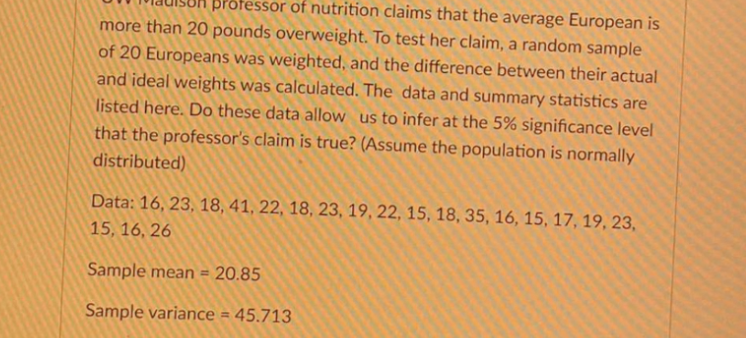
Transcribed Image Text:BPofessor of nutrition claims that the average European is
more than 20 pounds overweight. To test her claim, a random sample
of 20 Europeans was weighted, and the difference between their actual
and ideal weights was calculated. The data and summary statistics are
listed here. Do these data allow us to infer at the 5% significance level
that the professor's claim is true? (Assume the population is normally
distributed)
Data: 16, 23, 18, 41, 22, 18, 23, 19, 22, 15, 18, 35, 16, 15, 17, 19, 23,
15, 16, 26
Sample mean = 20.85
%3D
Sample variance = 45.713
Expert Solution
This question has been solved!
Explore an expertly crafted, step-by-step solution for a thorough understanding of key concepts.

This is a popular solution!

Trending now
This is a popular solution!

Step by step
Solved in 2 steps

Knowledge Booster


Learn more about
Need a deep-dive on the concept behind this application? Look no further. Learn more about this topic, statistics and related others by exploring similar questions and additional content below.Recommended textbooks for you
Glencoe Algebra 1, Student Edition, 9780079039897…
Algebra
ISBN:
9780079039897
Author:
Carter
Publisher:
McGraw Hill
Glencoe Algebra 1, Student Edition, 9780079039897…
Algebra
ISBN:
9780079039897
Author:
Carter
Publisher:
McGraw Hill