The nicotine content in miligrams of two samples of tobacco were found to be as Lallows: 25 26 21 27 Sample A Sample B 24 31 22 36 30 28 27 Can it be said that two samples come from normal populations having the same mean ?
The nicotine content in miligrams of two samples of tobacco were found to be as Lallows: 25 26 21 27 Sample A Sample B 24 31 22 36 30 28 27 Can it be said that two samples come from normal populations having the same mean ?

Glencoe Algebra 1, Student Edition, 9780079039897, 0079039898, 2018
18th Edition
ISBN:9780079039897
Author:Carter
Publisher:Carter
Chapter10: Statistics
Section10.3: Measures Of Spread
Problem 1GP

Related questions
Question
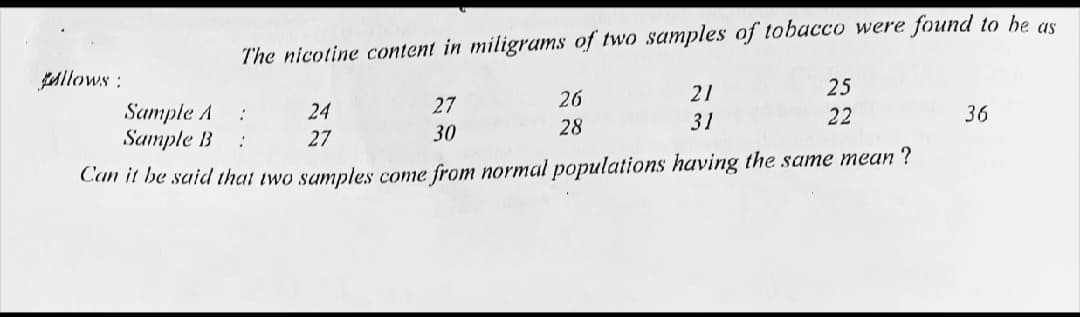
Transcribed Image Text:The nicotine content in miligrams of two samples of tobacco were found to be as
JAllows:
25
26
21
27
Sample A
Sample B
24
31
22
36
30
28
27
Can it be said that iwo samples come from normal populations having the same mean ?
Expert Solution
This question has been solved!
Explore an expertly crafted, step-by-step solution for a thorough understanding of key concepts.

Step by step
Solved in 2 steps with 2 images

Recommended textbooks for you
Glencoe Algebra 1, Student Edition, 9780079039897…
Algebra
ISBN:
9780079039897
Author:
Carter
Publisher:
McGraw Hill
Glencoe Algebra 1, Student Edition, 9780079039897…
Algebra
ISBN:
9780079039897
Author:
Carter
Publisher:
McGraw Hill