Table 1 below describes reported project status data in week 8 for the Beta project. The Beta project has a total budget of $460,000 and is expected to be completed in 15 weeks. Using the data below create a table that shows: A. The BCWS (entire project), BCWP (through week 8), and the ACWP (through week 8) B. The Cost Variance and the Schedule Variance (both through week 8) C. The Schedule Performance Index (SPI) and the Cost Performance index (CPI) (both through week 8)
Table 1 below describes reported project status data in week 8 for the Beta project. The Beta project has a total budget of $460,000 and is expected to be completed in 15 weeks. Using the data below create a table that shows: A. The BCWS (entire project), BCWP (through week 8), and the ACWP (through week 8) B. The Cost Variance and the Schedule Variance (both through week 8) C. The Schedule Performance Index (SPI) and the Cost Performance index (CPI) (both through week 8)

Practical Management Science
6th Edition
ISBN:9781337406659
Author:WINSTON, Wayne L.
Publisher:WINSTON, Wayne L.
Chapter2: Introduction To Spreadsheet Modeling
Section: Chapter Questions
Problem 20P: Julie James is opening a lemonade stand. She believes the fixed cost per week of running the stand...

Related questions
Question
Need help with problem 2
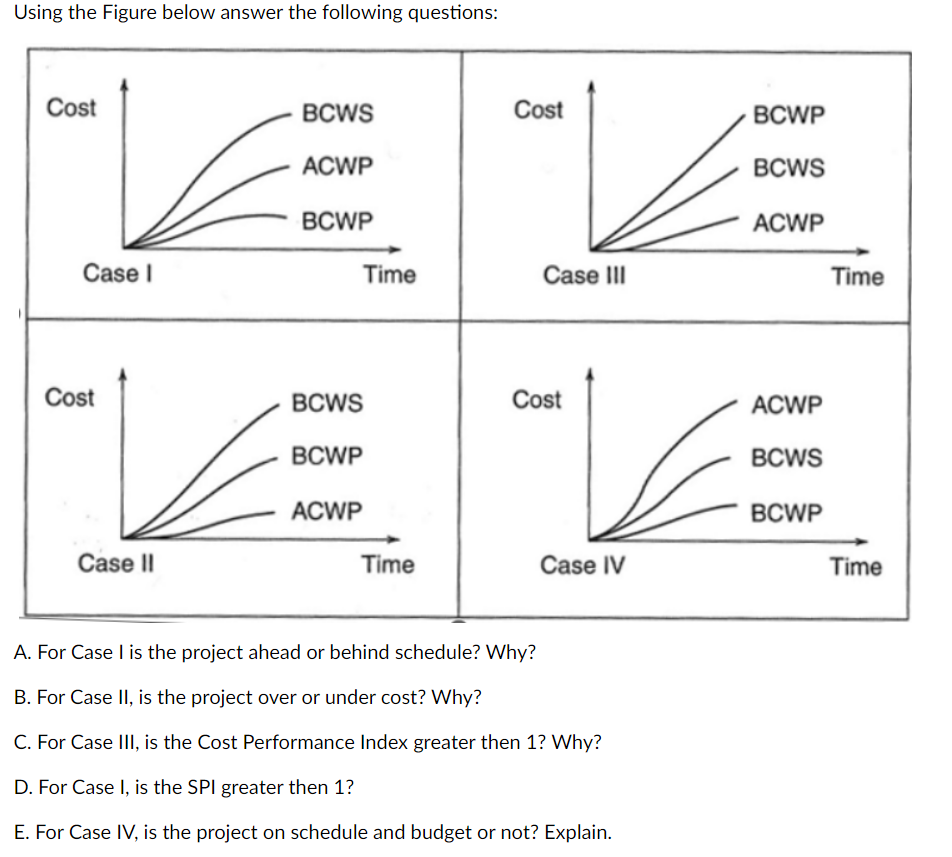
Transcribed Image Text:Using the Figure below answer the following questions:
Cost
Case I
Cost
Case II
BCWS
ACWP
BCWP
Time
BCWS
BCWP
ACWP
Time
Cost
Case III
Cost
Case IV
A. For Case I is the project ahead or behind schedule? Why?
B. For Case II, is the project over or under cost? Why?
C. For Case III, is the Cost Performance Index greater then 1? Why?
D. For Case I, is the SPI greater then 1?
E. For Case IV, is the project on schedule and budget or not? Explain.
BCWP
BCWS
ACWP
ACWP
BCWS
BCWP
Time
Time
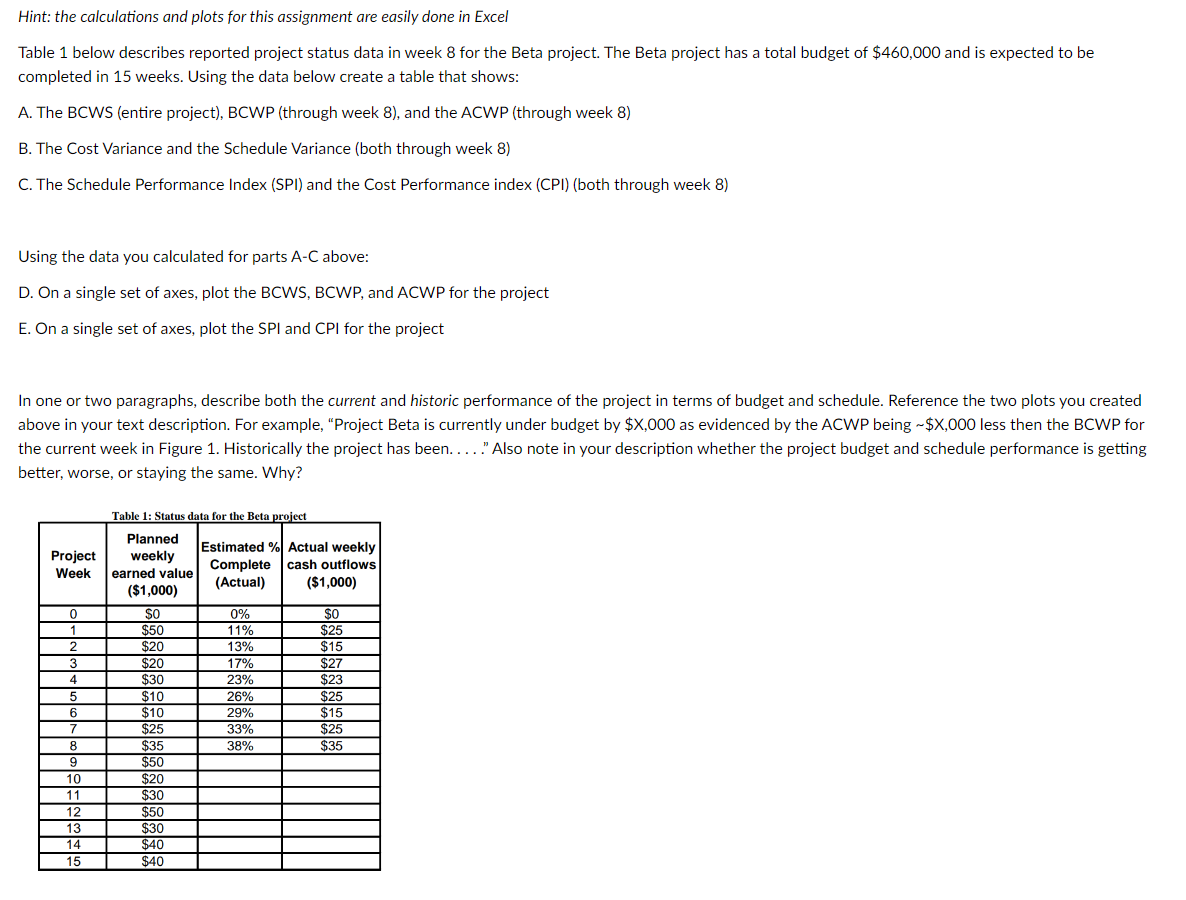
Transcribed Image Text:Hint: the calculations and plots for this assignment are easily done in Excel
Table 1 below describes reported project status data in week 8 for the Beta project. The Beta project has a total budget of $460,000 and is expected to be
completed in 15 weeks. Using the data below create a table that shows:
A. The BCWS (entire project), BCWP (through week 8), and the ACWP (through week 8)
B. The Cost Variance and the Schedule Variance (both through week 8)
C. The Schedule Performance Index (SPI) and the Cost Performance index (CPI) (both through week 8)
Using the data you calculated for parts A-C above:
D. On a single set of axes, plot the BCWS, BCWP, and ACWP for the project
E. On a single set of axes, plot the SPI and CPI for the project
In one or two paragraphs, describe both the current and historic performance of the project in terms of budget and schedule. Reference the two plots you created
above in your text description. For example, "Project Beta is currently under budget by $X,000 as evidenced by the ACWP being ~$X,000 less then the BCWP for
the current week in Figure 1. Historically the project has been....." Also note in your description whether the project budget and schedule performance is getting
better, worse, or staying the same. Why?
Project
Week
0
1
2
3
4
5
6
7
8
9
10
11
12
13
14
15
Table 1: Status data for the Beta project
Planned
weekly
earned value
($1,000)
$0
$50
$20
$20
$30
$10
$10
200
$25
2
$35
$39
$50
$20
$30
$50
$30
$40
$40
Estimated % Actual weekly
Complete cash outflows
(Actual) ($1,000)
0%
11%
13%
17%
23%
26%
29%
33%
38%
$0
$25
$15
$27
$23
$25
$15
$25
$35
Expert Solution
This question has been solved!
Explore an expertly crafted, step-by-step solution for a thorough understanding of key concepts.

This is a popular solution!

Trending now
This is a popular solution!

Step by step
Solved in 4 steps with 3 images

Recommended textbooks for you
Practical Management Science
Operations Management
ISBN:
9781337406659
Author:
WINSTON, Wayne L.
Publisher:
Cengage,

Operations Management
Operations Management
ISBN:
9781259667473
Author:
William J Stevenson
Publisher:
McGraw-Hill Education

Operations and Supply Chain Management (Mcgraw-hi…
Operations Management
ISBN:
9781259666100
Author:
F. Robert Jacobs, Richard B Chase
Publisher:
McGraw-Hill Education
Practical Management Science
Operations Management
ISBN:
9781337406659
Author:
WINSTON, Wayne L.
Publisher:
Cengage,
Operations Management
Operations Management
ISBN:
9781259667473
Author:
William J Stevenson
Publisher:
McGraw-Hill Education
Operations and Supply Chain Management (Mcgraw-hi…
Operations Management
ISBN:
9781259666100
Author:
F. Robert Jacobs, Richard B Chase
Publisher:
McGraw-Hill Education


Purchasing and Supply Chain Management
Operations Management
ISBN:
9781285869681
Author:
Robert M. Monczka, Robert B. Handfield, Larry C. Giunipero, James L. Patterson
Publisher:
Cengage Learning

Production and Operations Analysis, Seventh Editi…
Operations Management
ISBN:
9781478623069
Author:
Steven Nahmias, Tava Lennon Olsen
Publisher:
Waveland Press, Inc.