TABLE 1 Observed (O) versus expected (E) mc1r genotypes of black bears (Ursus americanus) by landmass in coastal British Columbia, Canada (2012-2017). Monte Carlo Exact Chi-square p-values reflect results from tests for departures from genotype frequencies expected under Hardy-Weinberg equilibrium. U-score p-values reflect tests for an excess or deficiency of heterozygosity at mc1r Landmass GG (white) E AG (black) E AA (black) E Chi² p U-score p Island Hawkesbury 0 0.00 0 0.00 24 24.00 Gribbell 1 1.13 7 6.75 10 10.12 1.00 0.74 Princess Royal 8 5.32 25 30.36 46 43.32 0.14 0.09 Roderick 0.01 1 0.98 21 21.01 1.00 1.00 Pooley 0 0.00 0 0.00 6 6.00 Yeo 0 0.00 0 0.00 5 5.00 Mainland West of Hawkesbury 0 0.03 2 1.94 East of Princess Royal 0 0.15 4 3.70 32 34 34.03 1.00 0.99 23 23.15 1.00 0.89 North of Roderick 0.02 1 0.96 11 11.02 1.00 1.00 Kynoch 0 0.00 0 0.00 15 15.00 Don Peninsula 0 0.01 1 0.98 21 21.01 1.00 1.00 6a. Consider all Islands with documented occurrences of the mc1r allele "G" as population 1 (the 3 Islands where "G" was detected). All mainland bears are population 2. Use the values in "Table 1" to calculate the allelic and genotypic frequencies for each population. b. Show whether population 1 is in Hardy-Weinberg Equilibrium using the bear numbers above. c. These bears have been studied over a number of years and sampled a number of ways - results regarding HWE have varied. Use what you know about the 5 assumptions of HWE (hint: pick one) to propose one possible reason why the population of Kermode bears may not be/have been in HWE.
TABLE 1 Observed (O) versus expected (E) mc1r genotypes of black bears (Ursus americanus) by landmass in coastal British Columbia, Canada (2012-2017). Monte Carlo Exact Chi-square p-values reflect results from tests for departures from genotype frequencies expected under Hardy-Weinberg equilibrium. U-score p-values reflect tests for an excess or deficiency of heterozygosity at mc1r Landmass GG (white) E AG (black) E AA (black) E Chi² p U-score p Island Hawkesbury 0 0.00 0 0.00 24 24.00 Gribbell 1 1.13 7 6.75 10 10.12 1.00 0.74 Princess Royal 8 5.32 25 30.36 46 43.32 0.14 0.09 Roderick 0.01 1 0.98 21 21.01 1.00 1.00 Pooley 0 0.00 0 0.00 6 6.00 Yeo 0 0.00 0 0.00 5 5.00 Mainland West of Hawkesbury 0 0.03 2 1.94 East of Princess Royal 0 0.15 4 3.70 32 34 34.03 1.00 0.99 23 23.15 1.00 0.89 North of Roderick 0.02 1 0.96 11 11.02 1.00 1.00 Kynoch 0 0.00 0 0.00 15 15.00 Don Peninsula 0 0.01 1 0.98 21 21.01 1.00 1.00 6a. Consider all Islands with documented occurrences of the mc1r allele "G" as population 1 (the 3 Islands where "G" was detected). All mainland bears are population 2. Use the values in "Table 1" to calculate the allelic and genotypic frequencies for each population. b. Show whether population 1 is in Hardy-Weinberg Equilibrium using the bear numbers above. c. These bears have been studied over a number of years and sampled a number of ways - results regarding HWE have varied. Use what you know about the 5 assumptions of HWE (hint: pick one) to propose one possible reason why the population of Kermode bears may not be/have been in HWE.

Human Heredity: Principles and Issues (MindTap Course List)
11th Edition
ISBN:9781305251052
Author:Michael Cummings
Publisher:Michael Cummings
Chapter19: Population Genetics And Human Evolution
Section: Chapter Questions
Problem 9QP: Using the HardyWeinberg Law in Human Genetics Suppose you are monitoring the allelic and genotypic...

Related questions
Question
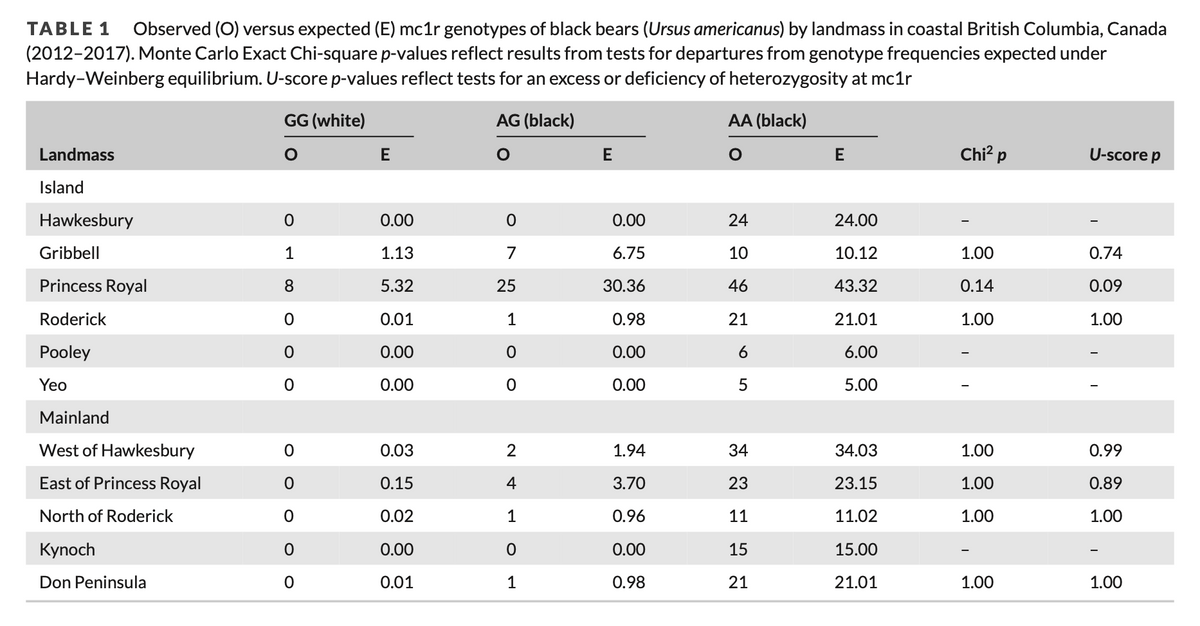
Transcribed Image Text:TABLE 1 Observed (O) versus expected (E) mc1r genotypes of black bears (Ursus americanus) by landmass in coastal British Columbia, Canada
(2012-2017). Monte Carlo Exact Chi-square p-values reflect results from tests for departures from genotype frequencies expected under
Hardy-Weinberg equilibrium. U-score p-values reflect tests for an excess or deficiency of heterozygosity at mc1r
Landmass
GG (white)
E
AG (black)
E
AA (black)
E
Chi² p
U-score p
Island
Hawkesbury
0
0.00
0
0.00
24
24.00
Gribbell
1
1.13
7
6.75
10
10.12
1.00
0.74
Princess Royal
8
5.32
25
30.36
46
43.32
0.14
0.09
Roderick
0.01
1
0.98
21
21.01
1.00
1.00
Pooley
0
0.00
0
0.00
6
6.00
Yeo
0
0.00
0
0.00
5
5.00
Mainland
West of Hawkesbury
0
0.03
2
1.94
East of Princess Royal
0
0.15
4
3.70
32
34
34.03
1.00
0.99
23
23.15
1.00
0.89
North of Roderick
0.02
1
0.96
11
11.02
1.00
1.00
Kynoch
0
0.00
0
0.00
15
15.00
Don Peninsula
0
0.01
1
0.98
21
21.01
1.00
1.00

Transcribed Image Text:6a. Consider all Islands with documented occurrences of the mc1r allele "G" as population 1 (the 3 Islands
where "G" was detected). All mainland bears are population 2. Use the values in "Table 1" to calculate the
allelic and genotypic frequencies for each population.
b. Show whether population 1 is in Hardy-Weinberg Equilibrium using the bear numbers above.
c. These bears have been studied over a number of years and sampled a number of ways - results regarding
HWE have varied. Use what you know about the 5 assumptions of HWE (hint: pick one) to propose one
possible reason why the population of Kermode bears may not be/have been in HWE.
Expert Solution
This question has been solved!
Explore an expertly crafted, step-by-step solution for a thorough understanding of key concepts.

Step by step
Solved in 1 steps

Recommended textbooks for you
Human Heredity: Principles and Issues (MindTap Co…
Biology
ISBN:
9781305251052
Author:
Michael Cummings
Publisher:
Cengage Learning
Human Heredity: Principles and Issues (MindTap Co…
Biology
ISBN:
9781305251052
Author:
Michael Cummings
Publisher:
Cengage Learning