" Table 10 provides the daily website traffic overview for the last week. The webmaster would like to know the number of users who visited the websi (a) Using the MATCH Function only, write a formula in cell C51 to find the Row (b) Using the INDEX Function only, write a formula in cell D51 to find the numb The formula should include the value (row number) computed in C51. Use cell reference for Day; don't hardcode the day text in the formula. Day Row number (Using MATCH) Users (Using Index)
" Table 10 provides the daily website traffic overview for the last week. The webmaster would like to know the number of users who visited the websi (a) Using the MATCH Function only, write a formula in cell C51 to find the Row (b) Using the INDEX Function only, write a formula in cell D51 to find the numb The formula should include the value (row number) computed in C51. Use cell reference for Day; don't hardcode the day text in the formula. Day Row number (Using MATCH) Users (Using Index)

Algebra & Trigonometry with Analytic Geometry
13th Edition
ISBN:9781133382119
Author:Swokowski
Publisher:Swokowski
Chapter4: Polynomial And Rational Functions
Section4.3: Zeros Of Polynomials
Problem 60E

Related questions
Question
Using the graph attached in screenshot below find the formulas needed to solve the problems attached as hell
thanks!
Transcribed Image Text:44
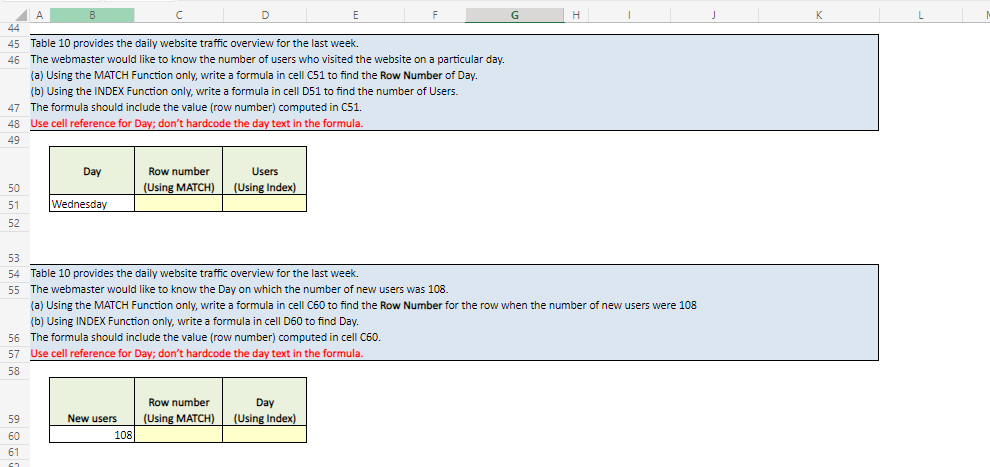
45 Table 10 provides the daily website traffic overview for the last week.
46
The webmaster would like to know the number of users who visited the website on a particular day.
(a) Using the MATCH Function only, write a formula in cell C51 to find the Row Number of Day.
(b) Using the INDEX Function only, write a formula in cell D51 to find the number of Users.
47
The formula should include the value (row number) computed in C51.
48 Use cell reference for Day; don't hardcode the day text in the formula.
49
50
51
52
53
54
55
56
57
58
A
59
60
61
Day
Wednesday
New users
Row number
(Using MATCH)
Table 10 provides the daily website traffic overview for the last week.
The webmaster would like to know the Day on which the number of new users was 108.
(a) Using the MATCH Function only, write a formula in cell C60 to find the Row Number for the row when the number of new users were 108
(b) Using INDEX Function only, write a formula in cell D60 to find Day.
The formula should include the value (row number) computed in cell C60.
Use cell reference for Day; don't hardcode the day text in the formula.
108
Users
(Using Index)
Row number
(Using MATCH)
Day
(Using Index)
Transcribed Image Text:9
10
11
12
13
14
15
16
17
18
19
20
A
B
E
F
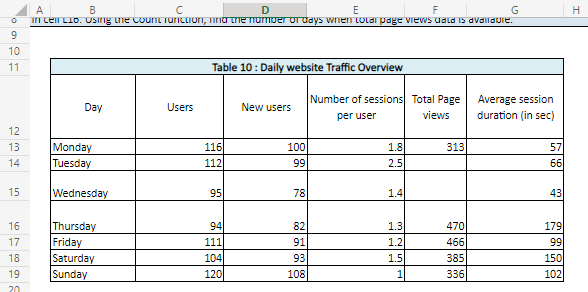
in cell L1o. Using the Count function, find the number of days when total page views dala is available.
Day
Monday
Tuesday
Wednesday
Thursday
Friday
Saturday
Sunday
Users
Table 10: Daily website Traffic Overview
116
112
95
94
111
104
120
New users
100
99
78
82
91
93
108
Number of sessions Total Page
per user
views
1.8
2.5
1.4
1.3
1.2
1.5
1
313
470
466
385
336
G
Average session
duration (in sec)
57
66
43
179
99
150
102
I
Expert Solution
This question has been solved!
Explore an expertly crafted, step-by-step solution for a thorough understanding of key concepts.

Step by step
Solved in 3 steps with 2 images

Recommended textbooks for you
Algebra & Trigonometry with Analytic Geometry
Algebra
ISBN:
9781133382119
Author:
Swokowski
Publisher:
Cengage
Algebra & Trigonometry with Analytic Geometry
Algebra
ISBN:
9781133382119
Author:
Swokowski
Publisher:
Cengage