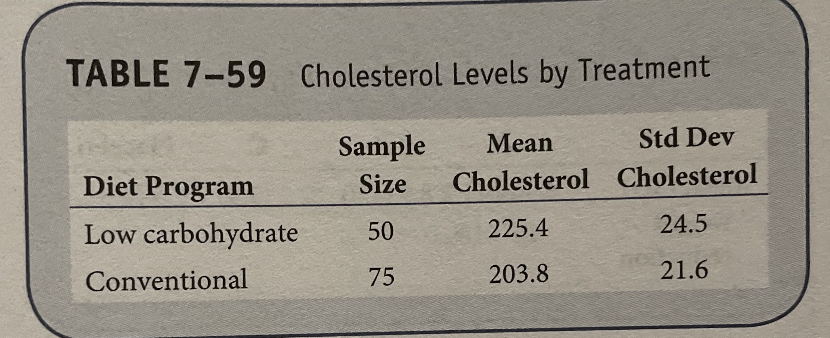
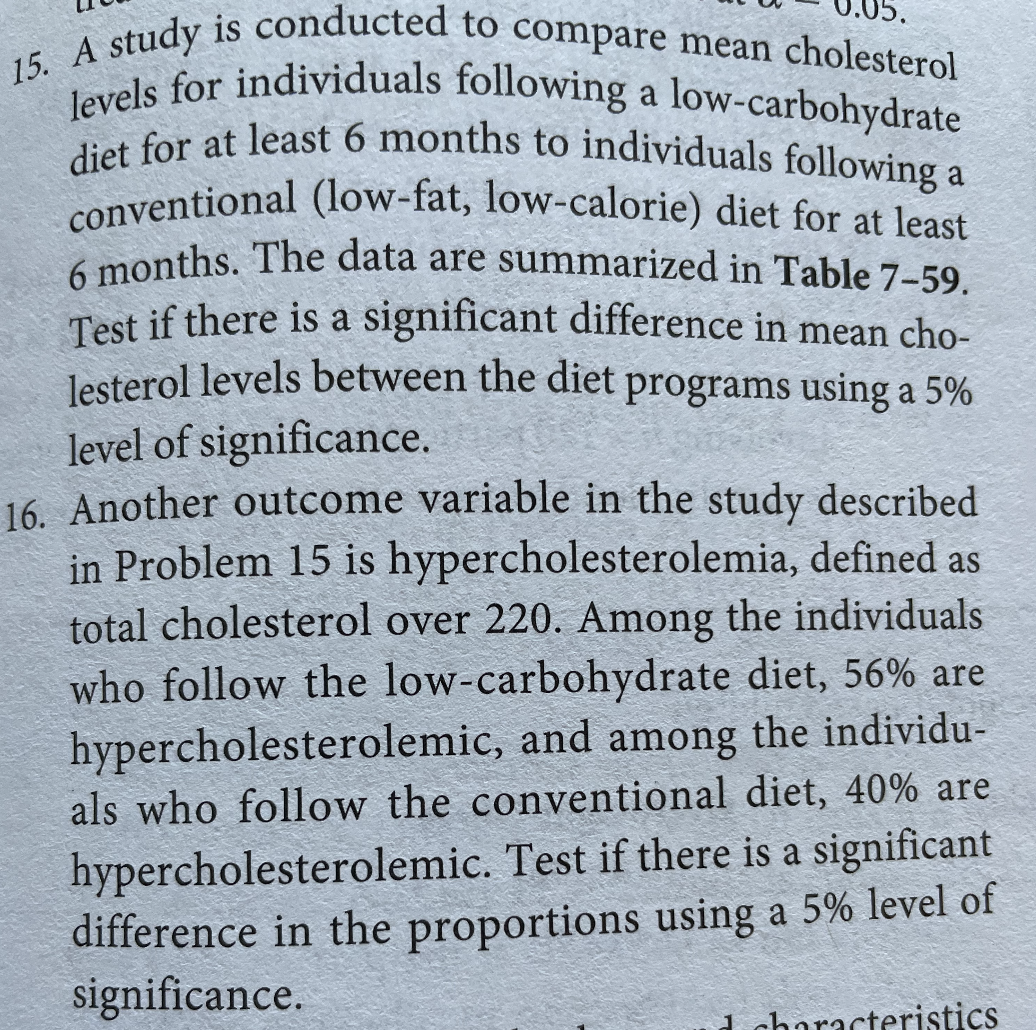
TABLE 7-59 Cholesterol Levels by Treatment Sample Mean Std Dev Diet Program Cholesterol Cholesterol Size Low carbohydrate 225.4 24.5 50 Conventional 75 203.8 21.6 15. A study is conducted to compare mean cholesterol conventional (low-fat, low-calorie) diet for at least 6 months. The data are summarized in Table 7-59. levels for individuals following a low-carbohydrate diet for at least 6 months to individuals following a onventional (low-fat, low-calorie) diet for at least k months. The data are summarized in Table 7-59. Test if there is a significant difference in mean cho- lesterol levels between the diet programs using a 5% level of significance. 16. Another outcome variable in the study described in Problem 15 is hypercholesterolemia, defined as total cholesterol over 220. Among the individuals who follow the low-carbohydrate diet, 56% are hypercholesterolemic, and among the individu- als who follow the conventional diet, 40% are hypercholesterolemic. Test if there is a significant difference in the proportions using a 5% level of significance. 1 characteristics


Hi! Thank you for posting the question. Since you have posted multiple questions, we are answering first question. If you need help with any other question, please re-post the question and mention the part you need help with.
The aim is to check whether there is difference in mean cholesterol levels between the diet programs using a 5% level of significance.
The null and alternative hypotheses are:
Here, µ1 is the average cholesterol level during low carbohydrate diet, and µ2 is the average cholesterol level during conventional diet.
It is assumed that variances are not equal.
The formula for test statistic for non pooled variance is as follows
Where y1-bar and y2-bar are the sample means.
(µ1-µ2)0 is the difference between hypothesized mean, s1 and s2 are the sample standard deviation.
n1 and n2 are the two sample sizes.

Step by step
Solved in 2 steps

