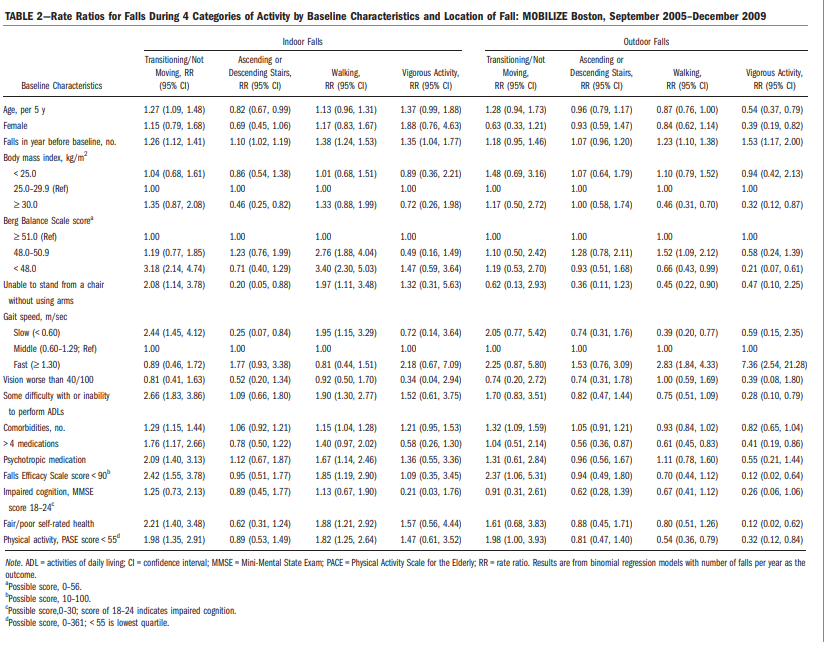
Table 2 on page 2152 gives point and confidence interval estimates of the RR for different groups of people and different types of activities. Consider the characteristic of gait speed, which is broken down into 3 categories: slow, middle, and fast. Why are the RR's for the middle category all exactly 1?
Table 2 on page 2152 gives point and confidence interval estimates of the RR for different groups of people and different types of activities. Consider the characteristic of gait speed, which is broken down into 3 categories: slow, middle, and fast. Why are the RR's for the middle category all exactly 1?

Linear Algebra: A Modern Introduction
4th Edition
ISBN:9781285463247
Author:David Poole
Publisher:David Poole
Chapter4: Eigenvalues And Eigenvectors
Section4.6: Applications And The Perron-frobenius Theorem
Problem 25EQ

Related questions

Question
Table 2 on page 2152 gives point and confidence
Transcribed Image Text:TABLE 2-Rate Ratios for Falls During 4 Categories of Activity by Baseline Characteristics and Location of Fall: MOBILIZE Boston, September 2005-December 2009
Indoor Falls
Outdoor Falls
Transitioning/Not
Moving, R
(95% CI)
Ascending or
Descending Stairs,
RR (95% CI)
Walking,
AR (95% CI)
Vigorous Activity,
RR (95% CI)
Transitioning/Not
Moving,
RR (95% CI)
Ascending or
Descending Stairs,
RR (95% C)
Walking,
RR (95% CI)
Vigorous Activity,
RR (95% CI)
Baseline Characteristics
Age, per 5 y
1.27 (1.09, 1.48)
0.82 (0.67, 0.99)
1.13 (0.96, 1.31)
1.37 (0.99, 1.88)
1.28 (0.94, 1.73)
0.96 (0.79, 1.17)
0.87 (0.76, 1.00)
0.54 (0.37, 0.79)
Female
1.15 (0.79, 1.68)
0.69 (0.45, 1.06)
1.17 (0.83, 1.67)
1.88 (0.76, 4.63)
0.63 (0.33, 1.21)
0.93 (0.59, 1.47)
0.84 (0.62, 1.14)
0.39 (0.19, 0.82)
Falls in year before baseline, no.
1.26 (1.12, 1.41)
1.10 (1.02, 1.19)
1.38 (1.24, 1.53)
1.35 (1.04, 1.77)
1.18 (0.95, 1.46)
1.07 (0.96, 1.20)
1.23 (1.10, 1.38)
1.53 (1.17, 2.00)
Body mass inder, kg/m?
< 25.0
25.0-29.9 (Ref)
1.04 (0.68, 1.61)
0.86 (0.54, 1.38)
1.01 (0.68, 1.51)
0.89 (0.36, 2.21)
1.48 (0.69, 3.16)
1.07 (0.64, 1.79)
1.10 (0.79, 1.52)
0.94 (0.42, 2.13)
1.00
1.00
1.00
1.00
1.00
1.00
1.00
1.00
2 30.0
1.35 (0.87, 2.08)
0.46 (0.25, 0.82)
1.33 (0.88, 1.99)
0.72 (0.26, 1.98)
1.17 (0.50, 2.72)
1.00 (0.58, 1.74)
0.46 (0.31, 0.70)
0.32 (0.12, 0.87)
Berg Balance Scale score
251.0 (Rel)
1.00
1.00
1.00
1.00
1.00
1.00
1.00
1.00
48.0-50.9
1.19 (0.77, 1.85)
1.23 (0.76, 1.99)
2.76 (1.88, 4.04)
0.49 (0.16, 1.49)
1.10 (0.50, 2.42)
1.28 (0.78, 2.11)
1.52 (1.09, 2.12)
0.58 (0.24, 1.39)
< 48.0
3.18 (2.14, 4.74)
0.71 (0.40, 1.29)
3.40 (2.30, 5.03)
1.47 (0.59, 3.64)
1.19 (0.53, 2.70)
0.93 (0.51, 1.68)
0.66 (0.43, 0.99)
0.21 (0.07, 0.61)
Unable to stand from a chair
2.08 (1.14, 3.78)
0.20 (0.05, 0.88)
1.97 (1.11, 3.48)
1.32 (0.31, 5.63)
0.62 (0.13, 2.93)
0.36 (0.11, 1.23)
0.45 (0.22, 0.90)
0.47 (0.10, 2.25)
without using arms
Gait speed, m/sec
Slow (< 0.60)
2.44 (1.45, 4.12)
0.25 (0.07, 0.84)
1.95 (1.15, 3.29)
0.72 (0.14, 3.64)
2.05 (0.77, 5.42)
0.74 (0.31, 1.76)
0.39 (0.20, 0.77)
0.59 (0.15, 2.35)
Middle (0.60-1.29; Ref)
1.00
1.00
1.00
1.00
1.00
1.00
1.00
1.00
Fast (21.30)
0.89 (0.46, 1.72)
0.81 (0.41, 1.63)
1.77 (0.93, 3.38)
0.52 (0.20, 1.34)
0.81 (0.44, 1.51)
0.92 (0.50, 1.70)
1.53 (0.76, 3.09)
0.74 (0.31, 1.78)
2.83 (1.84, 4.33)
1.00 (0.59, 1.69)
2.18 (0.67, 7.09)
2.25 (0.87, 5.80)
7.36 (2.54, 21.28)
Vision worse than 40/100
0.34 (0.04, 2.94)
0.74 (0.20, 2.72)
0.39 (0.08, 1.80)
Some difficulty with or inability
2.66 (1.83, 3.86)
1.09 (0.66, 1.80)
1.90 (1.30, 2.77)
1.52 (0.61, 3.75)
1.70 (0.83, 3.51)
0.82 (0.47, 1.44)
0.75 (0.51, 1.09)
0.28 (0.10, 0.79)
to perform ADLS
Comorbidities, no.
1.29 (1.15, 1.44)
1.06 (0.92, 1.21)
1.15 (1.04, 1.28)
1.21 (0.95, 1.53)
1.32 (1.09, 1.59)
1.05 (0.91, 1.21)
0.93 (0.84, 1.02)
0.82 (0.65, 1.04)
>4 medications
1.76 (1.17, 2.66)
0.78 (0.50, 1.22)
1.12 (0.67, 1.87)
1.40 (0.97, 2.02)
0.58 (0.26, 1.30)
1.04 (0.51, 2.14)
0.56 (0.36, 0.87)
0.61 (0.45, 0.83)
0.41 (0.19, 0.86)
Psychotropic medication
Falls Efficacy Scale score < 90°
2.09 (1.40, 3.13)
1.67 (1.14, 2.46)
1.36 (0.55, 3.36)
1.31 (0.61, 2.84)
0.96 (0.56, 1.67)
1.11 (0.78, 1.60)
0.55 (0.21, 1.44)
0.12 (0.02, 0.64)
2.42 (1.55, 3.78)
0.95 (0.51, 1.77)
0.89 (0.45, 1.77)
1.85 (1.19, 2.90)
1.09 (0.35, 3.45)
2.37 (1.06, 5.31)
0.94 (0.49, 1.80)
0.70 (0.44, 1.12)
Impaired cognition, MMSE
1.25 (0.73, 2.13)
1.13 (0.67, 1.90)
0.21 (0.03, 1.76)
0.91 (0.31, 2.61)
0.62 (0.28, 1.39)
0.67 (0.41, 1.12)
0.26 (0.06, 1.06)
score 18-24
Fair/poor self-rated health
2.21 (1.40, 3.48)
0.62 (0.31, 1.24)
1.88 (1.21, 2.92)
1.57 (0.56, 4.44)
1.61 (0.68, 3.83)
0.88 (0.45, 1.71)
0.80 (0.51, 1.26)
0.12 (0.02, 0.62)
Physical activity, PASE score < 55°
1.98 (1.35, 2.91)
0.89 (0.53, 1.49)
1.82 (1.25, 2.64)
1.47 (0.61, 3.52)
1.98 (1.00, 3.93)
0.81 (0.47, 1.40)
0.54 (0.36, 0.79)
0.32 (0.12, 0.84)
Note. ADL - activities of daily living Cl = confidence interval; MMSE = Mini-Mental State Examç PACE = Physical Activity Scale for the Elderly; RR = rate ratio. Results are from binomial regression models with number of falls per year as the
outcome.
*Possible score, 0-56.
"Possible score, 10-100.
"Possible score,0-30; score of 18-24 indicates impaired cognition.
"Possible score, 0-361; < 55 is lowest quartile.
Expert Solution
This question has been solved!
Explore an expertly crafted, step-by-step solution for a thorough understanding of key concepts.

This is a popular solution!

Trending now
This is a popular solution!

Step by step
Solved in 2 steps with 1 images

Knowledge Booster


Learn more about
Need a deep-dive on the concept behind this application? Look no further. Learn more about this topic, statistics and related others by exploring similar questions and additional content below.Recommended textbooks for you
Linear Algebra: A Modern Introduction
Algebra
ISBN:
9781285463247
Author:
David Poole
Publisher:
Cengage Learning

Functions and Change: A Modeling Approach to Coll…
Algebra
ISBN:
9781337111348
Author:
Bruce Crauder, Benny Evans, Alan Noell
Publisher:
Cengage Learning

Glencoe Algebra 1, Student Edition, 9780079039897…
Algebra
ISBN:
9780079039897
Author:
Carter
Publisher:
McGraw Hill
Linear Algebra: A Modern Introduction
Algebra
ISBN:
9781285463247
Author:
David Poole
Publisher:
Cengage Learning
Functions and Change: A Modeling Approach to Coll…
Algebra
ISBN:
9781337111348
Author:
Bruce Crauder, Benny Evans, Alan Noell
Publisher:
Cengage Learning
Glencoe Algebra 1, Student Edition, 9780079039897…
Algebra
ISBN:
9780079039897
Author:
Carter
Publisher:
McGraw Hill