TABLE 2 TABLE 3 Phoenix, AZ Average Temperatures Month Attendance 40,000 - 35,000 Jan January February 54 6,500 30,000 Feb 58 6,600 25,000 Mar 62 March 15,800 20,000 Apr 70 April 26,000 15,000 - May 79 May 38,000 10,000 - Jun 88 June 36,000 5,000 - Jul 94 31,300 July August September 2 3 4 5 6 7 8 9 10 1 12 1: Aug 92 23,500 Sep 86 12,000 Figure 14 Oct 75 October 4,000 Nov 62 November 900 Dec 54 December 2,100
TABLE 2 TABLE 3 Phoenix, AZ Average Temperatures Month Attendance 40,000 - 35,000 Jan January February 54 6,500 30,000 Feb 58 6,600 25,000 Mar 62 March 15,800 20,000 Apr 70 April 26,000 15,000 - May 79 May 38,000 10,000 - Jun 88 June 36,000 5,000 - Jul 94 31,300 July August September 2 3 4 5 6 7 8 9 10 1 12 1: Aug 92 23,500 Sep 86 12,000 Figure 14 Oct 75 October 4,000 Nov 62 November 900 Dec 54 December 2,100

Chapter12: Sequences, Series And Binomial Theorem
Section12.3: Geometric Sequences And Series
Problem 12.58TI: What is the total effect on the economy of a government tax rebate of $500 to each household in...

Related questions

Question
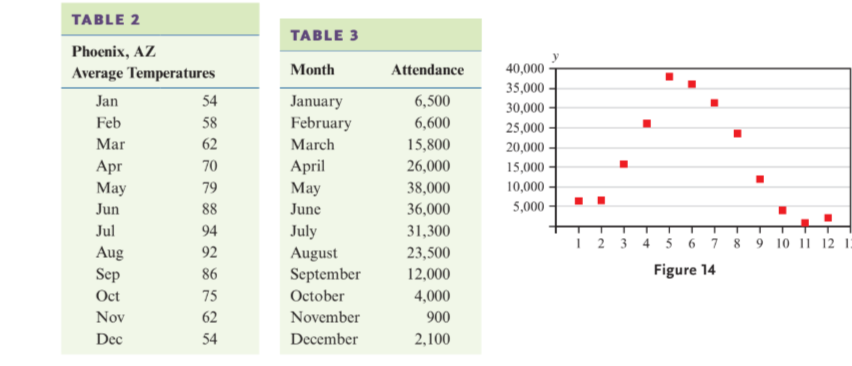
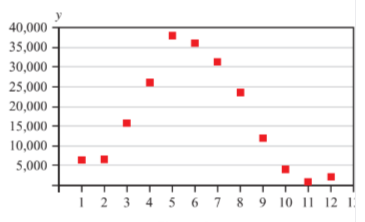
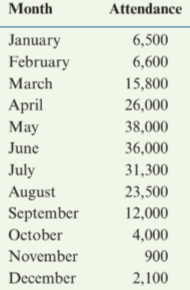
Table 3 shows the average monthly attendance at Lake
Nacimiento in California. Find the equation of a trigonometric
as a model for this data. (Source: Nacimiento Water Supply Project: Report on
Recreational Use at Lake Nacimiento)
Transcribed Image Text:TABLE 2
TABLE 3
Phoenix, AZ
Average Temperatures
Month
Attendance
40,000 -
35,000
Jan
January
February
54
6,500
30,000
Feb
58
6,600
25,000
Mar
62
March
15,800
20,000
Apr
70
April
26,000
15,000 -
May
79
May
38,000
10,000 -
Jun
88
June
36,000
5,000 -
Jul
94
31,300
July
August
September
2 3 4 5 6 7 8 9 10 1 12 1:
Aug
92
23,500
Sep
86
12,000
Figure 14
Oct
75
October
4,000
Nov
62
November
900
Dec
54
December
2,100
Expert Solution
Step 1
Below graph and table shows the average monthly attendance at Lake Nacimiento in California.
Step 2
Use the cosine function model, .
The amplitude A is the half of the difference between highest point and lowest point.
The vertical translation k is the average of highest point and lowest point.
The maximum value occur at and the minimum value occur at .
The horizonal distance between maximum and minimum values is the half of the period.
Period =

Step by step
Solved in 3 steps with 2 images

Knowledge Booster


Learn more about
Need a deep-dive on the concept behind this application? Look no further. Learn more about this topic, trigonometry and related others by exploring similar questions and additional content below.Recommended textbooks for you