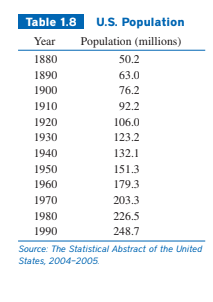
Table 1.8 U.S. Population Year Population (millions) 1880 50.2 1890 63.0 1900 76.2 1910 92.2 1920 106.0 1930 123.2 1940 132.1 1950 151.3 1960 179.3 1970 203.3 1980 226.5 1990 248.7 Source: The Statistical Abstract of the United States, 2004-2005.


Inverse Normal Distribution
The method used for finding the corresponding z-critical value in a normal distribution using the known probability is said to be an inverse normal distribution. The inverse normal distribution is a continuous probability distribution with a family of two parameters.
Mean, Median, Mode
It is a descriptive summary of a data set. It can be defined by using some of the measures. The central tendencies do not provide information regarding individual data from the dataset. However, they give a summary of the data set. The central tendency or measure of central tendency is a central or typical value for a probability distribution.
Z-Scores
A z-score is a unit of measurement used in statistics to describe the position of a raw score in terms of its distance from the mean, measured with reference to standard deviation from the mean. Z-scores are useful in statistics because they allow comparison between two scores that belong to different normal distributions.
Use the population data in Table 1.8 to estimate the population for the year 2000. Com-
pare the result with the actual 2000 population of approximately 281.4 million.

Step by step
Solved in 3 steps


