Table 3.10 relates the weights and heights of a group of individuals participating in an observational study. Weight/Height Tall Medium Short Totals Obese 18 28 14 Normal 20 51 28 Underweight 12 25 9. Totals Table 3.10 a. Find the total for each row and column b. Find the probability that a randomly chosen individual from this group is Tall. c. Find the probability that a randomly chosen individual from this group is Obese and Tall.
Table 3.10 relates the weights and heights of a group of individuals participating in an observational study. Weight/Height Tall Medium Short Totals Obese 18 28 14 Normal 20 51 28 Underweight 12 25 9. Totals Table 3.10 a. Find the total for each row and column b. Find the probability that a randomly chosen individual from this group is Tall. c. Find the probability that a randomly chosen individual from this group is Obese and Tall.

Chapter9: Sequences, Probability And Counting Theory
Section9.7: Probability
Problem 6TI: A child randomly selects 3 gumballs from a container holding 4 purple gumballs, 8 yellow gumballs,...

Related questions
Question
Transcribed Image Text:TRY IT 3.23
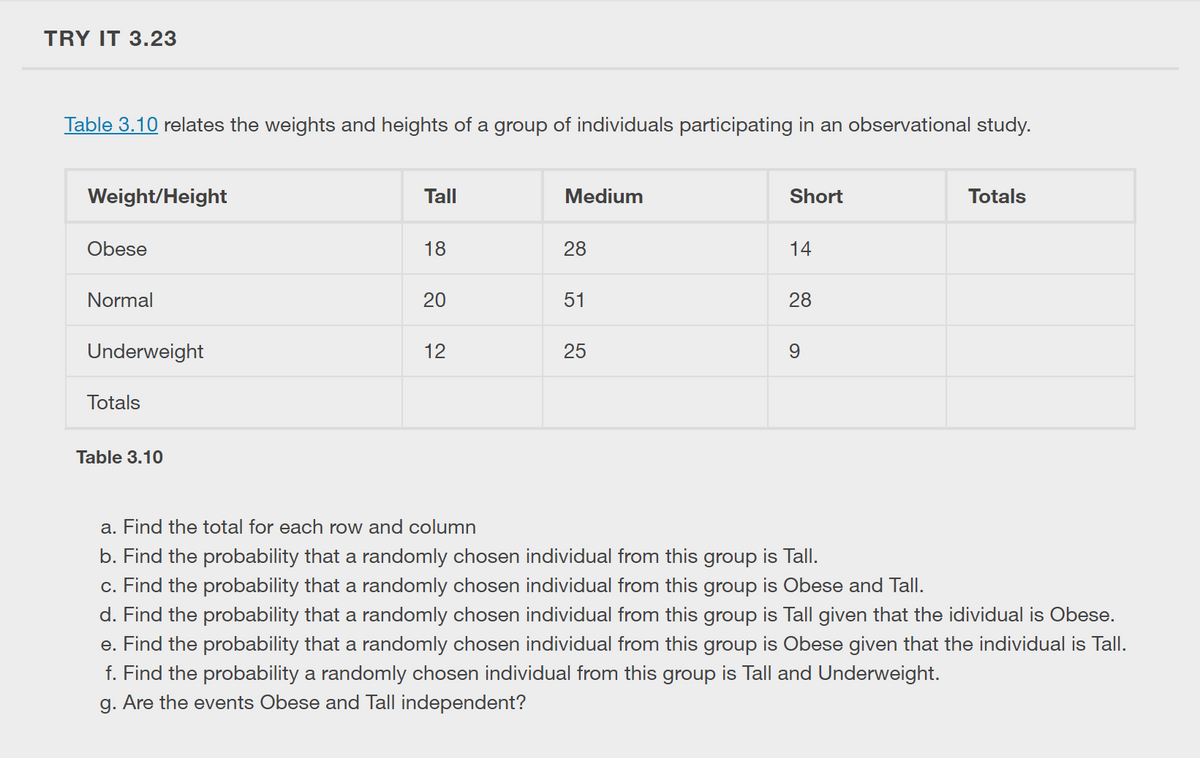
Table 3.10 relates the weights and heights of a group of individuals participating in an observational study.
Weight/Height
Tall
Medium
Short
Totals
Obese
18
28
14
Normal
20
51
28
Underweight
12
25
9.
Totals
Table 3.10
a. Find the total for each row and column
b. Find the probability that a randomly chosen individual from this group is TallI.
c. Find the probability that a randomly chosen individual from this group is Obese and Tall.
d. Find the probability that a randomly chosen individual from this group is Tall given that the idividual is Obese.
e. Find the probability that a randomly chosen individual from this group is Obese given that the individual is Tall.
f. Find the probability a randomly chosen individual from this group is Tall and Underweight.
g. Are the events Obese and Tall independent?
Expert Solution
This question has been solved!
Explore an expertly crafted, step-by-step solution for a thorough understanding of key concepts.

This is a popular solution!

Trending now
This is a popular solution!

Step by step
Solved in 2 steps with 2 images

Knowledge Booster


Learn more about
Need a deep-dive on the concept behind this application? Look no further. Learn more about this topic, statistics and related others by exploring similar questions and additional content below.Recommended textbooks for you