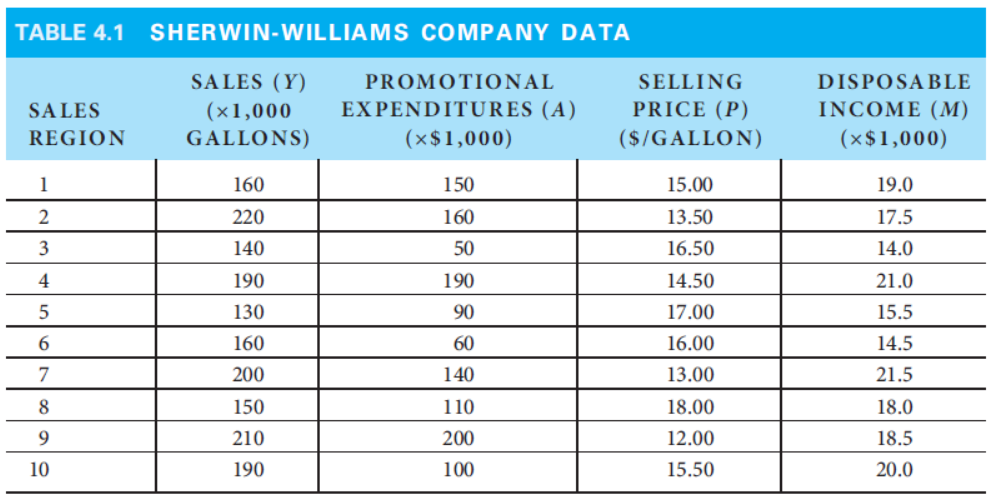
TABLE 4.1 SHERWIN-WILLIAMS COMPANY DATA SALES (Y) PROMOTIONAL SELLING DISPOSABLE SALES EXPENDITURES (A) PRICE (P) INCOME (M) (x1,000 GALLONS) REGION (x$1,000) ($/GALLON) (x$1,000) 1 160 150 15.00 19.0 2 220 160 13.50 17.5 140 50 16.50 14.0 4 190 190 14.50 21.0 130 90 17.00 15.5 160 60 16.00 14.5 7 200 140 13.00 21.5 8 150 110 18.00 18.0 9. 210 200 12.00 18.5 10 190 100 15.50 20.0


Correlation
Correlation defines a relationship between two independent variables. It tells the degree to which variables move in relation to each other. When two sets of data are related to each other, there is a correlation between them.
Linear Correlation
A correlation is used to determine the relationships between numerical and categorical variables. In other words, it is an indicator of how things are connected to one another. The correlation analysis is the study of how variables are related.
Regression Analysis
Regression analysis is a statistical method in which it estimates the relationship between a dependent variable and one or more independent variable. In simple terms dependent variable is called as outcome variable and independent variable is called as predictors. Regression analysis is one of the methods to find the trends in data. The independent variable used in Regression analysis is named Predictor variable. It offers data of an associated dependent variable regarding a particular outcome.
Consider again the Sherwin-Williams Company example discussed in the Table. Suppose one is interested in developing a multiple regression model with paint sales (Y) as the dependent variable and promotional expenditures (A) and selling price (P) as the independent variables.
a. Determine the estimated regression line.
b. Give an economic interpretation of the estimated slope (bs) coefficients.
c. Test the hypothesis (at the 5 percent level of significance) that there is no relationship between the dependent variable and each of the independent variables.
d. Determine the coefficient of determination.
e. Perform an analysis of variance on the regression, including an F-test of the overall significance of the results (at the 5 percent level).
f. Based on the regression model, determine the best estimate of paint sales in a sales region where promotional expenditures are $80(000) and the selling price is $12.50.
g. Determine the point promotional and price elasticities at the values of promotional expenditures and selling price given in part (f).


Trending now
This is a popular solution!

Step by step
Solved in 4 steps with 3 images


