Table gives observations regarding customers at a single-server FCFS queue. (a) Compute the average time in the queue and the average time in the system. (b) Calculate the average system waiting time of those customers who had to wait for service (i.e., exclude those who were immediately taken into service). Calculate the average length of the queue, the average number in the system, and the fraction of idle time of the server. (c) Using the Excel spreadsheet, for example, plot the the graph of {N(t), 0
Table gives observations regarding customers at a single-server FCFS queue. (a) Compute the average time in the queue and the average time in the system. (b) Calculate the average system waiting time of those customers who had to wait for service (i.e., exclude those who were immediately taken into service). Calculate the average length of the queue, the average number in the system, and the fraction of idle time of the server. (c) Using the Excel spreadsheet, for example, plot the the graph of {N(t), 0

Practical Management Science
6th Edition
ISBN:9781337406659
Author:WINSTON, Wayne L.
Publisher:WINSTON, Wayne L.
Chapter12: Queueing Models
Section12.5: Analytic Steady-state Queueing Models
Problem 21P

Related questions
Question
please do not copy other's work,thank you very much
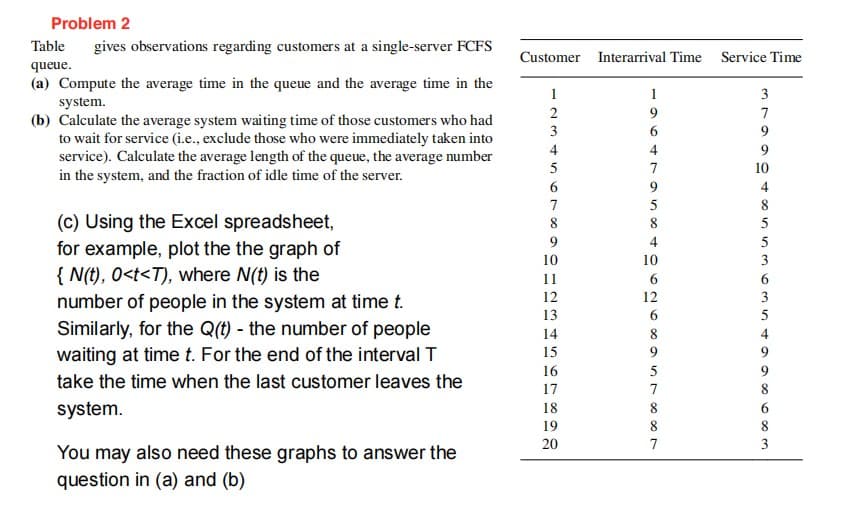
Transcribed Image Text:Problem 2
Table gives observations regarding customers at a single-server FCFS
queue.
(a) Compute the average time in the queue and the average time in the
system.
(b) Calculate the average system waiting time of those customers who had
to wait for service (i.e., exclude those who were immediately taken into
service). Calculate the average length of the queue, the average number
in the system, and the fraction of idle time of the server.
(c) Using the Excel spreadsheet,
for example, plot the the graph of
{N(t), 0<t<T), where N(t) is the
number of people in the system at time t.
Similarly, for the Q(t) - the number of people
waiting at time t. For the end of the interval T
take the time when the last customer leaves the
system.
You may also need these graphs to answer the
question in (a) and (b)
Customer Interarrival Time Service Time
1
2
234
5
6
7
8
9
10
11
12
13
14
15
16
17
18
19
20
1
6
7
9
8
4
10
6
12
8
9
7
8
7
3
7
9
10
4
8
∞ ∞ ∞ 66 Aswa win no
5
5
3
6
3
5
9
8
8
3
Expert Solution
This question has been solved!
Explore an expertly crafted, step-by-step solution for a thorough understanding of key concepts.

This is a popular solution!

Trending now
This is a popular solution!

Step by step
Solved in 4 steps with 6 images

Recommended textbooks for you
Practical Management Science
Operations Management
ISBN:
9781337406659
Author:
WINSTON, Wayne L.
Publisher:
Cengage,

Marketing
Marketing
ISBN:
9780357033791
Author:
Pride, William M
Publisher:
South Western Educational Publishing
Practical Management Science
Operations Management
ISBN:
9781337406659
Author:
WINSTON, Wayne L.
Publisher:
Cengage,
Marketing
Marketing
ISBN:
9780357033791
Author:
Pride, William M
Publisher:
South Western Educational Publishing