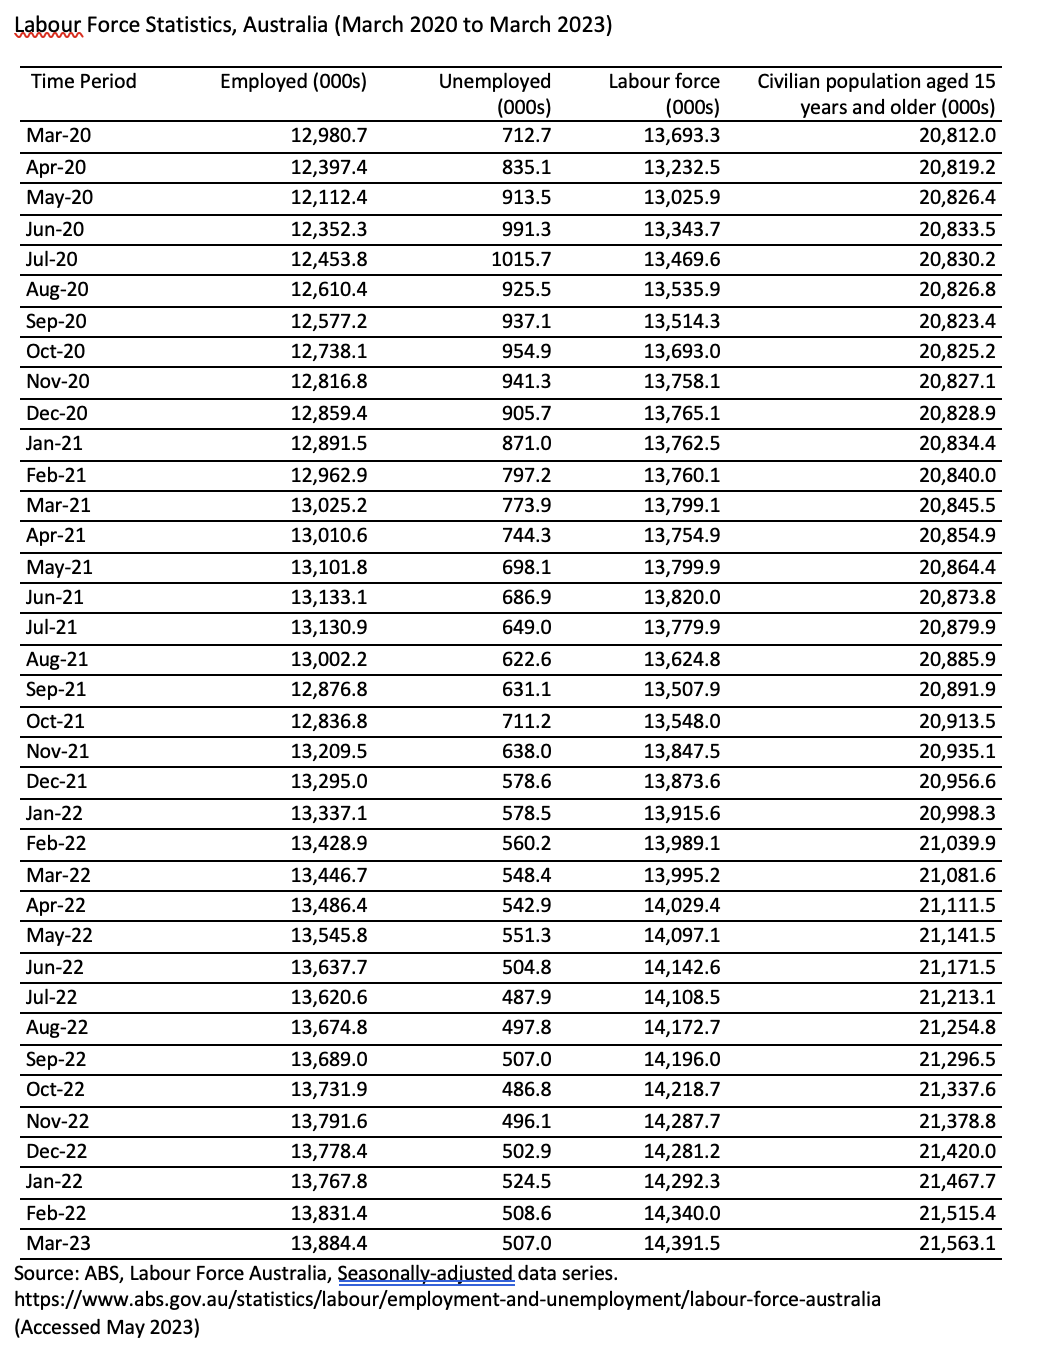
The RBA, like the Treasury, is also monitoring Australia’s unemployment rate. The following table provides labour market data from the Australian Bureau of Statistics (ABS). At the start of the pandemic, job losses and rising unemployment across the economy were a concern for the RBA and Treasury. Your colleague has calculated that the pre-pandemic unemployment rate (in March 2020) was 5.2%. Using the data in the table, how high did Australia’s unemployment rate reach throughout the worse of the pandemic and in which month did this occur? When looking the unemployment rate, what other labour force indicator would you recommend also looking at to fully understand the impact of the pandemic on the economy? To support your calculations, include all your working and the formulas you applied to compute the unemployment rate. For this labour market data, round off your answers to 2 decimal points. When you obtain your answers, write a clear sentence that addresses the specific questions that have been asked.


The RBA, like the Treasury, is also monitoring Australia’s
At the start of the pandemic, job losses and rising unemployment across the economy were a concern for the RBA and Treasury. Your colleague has calculated that the pre-pandemic unemployment rate (in March 2020) was 5.2%. Using the data in the table, how high did Australia’s unemployment rate reach throughout the worse of the pandemic and in which month did this occur?
When looking the unemployment rate, what other labour force indicator would you recommend also looking at to fully understand the impact of the pandemic on the economy?
To support your calculations, include all your working and the formulas you applied to compute the unemployment rate. For this labour market data, round off your answers to 2 decimal points. When you obtain your answers, write a clear sentence that addresses the specific questions that have been asked.

Step by step
Solved in 3 steps

- The experience of the Global Financial Crisis made policymakers vigilant about ensuring the stability of the financial system and avoiding a repeat of the GFC during the shock of COVID-19 pandemic.
Choose one of the following policies as an example of prudential regulation and explain how it contributes to the stability of the financial system. (1-2 sentences)
- Policy #1 The decision made by the Board of the Reserve Bank of Australia to lift the cash rate to prevent runaway inflation.
- Policy #2 Deregulation of the financial market which introduced a floating exchange rate.
- Policy #3 The tightening of lending limits on commercial banks and the requirement that all commercial banks hold an Exchange Settlement account with the Central Bank
task 1: A new colleague working with you on the
Firstly, verify whether your colleague is correct when they say that the unemployment rate increased between July 2022 and August 2022.
Next, help your colleague understand how it is possible for the unemployment rate to rise even though the number of people with jobs also rose. Explain what other economic indicator needs to be monitored and provide your calculation of the changes in this other indicator that occurred between July 2022 and August 2022.
To support your calculations, include all your working and the formulas you applied to compute these labor market statistics. Round off your answers to 2 decimal points. When you obtain your answers, write a clear sentence that addresses the specific questions that have been asked.
task 2: The experience of the Global Financial Crisis made policymakers vigilant about ensuring the stability of the financial system and avoiding a repeat of the GFC during the shock of COVID-19 pandemic.
Choose one of the following policies as an example of prudential regulation and explain how it contributes to the stability of the financial system. (1-2 sentences)
- Policy #1 The decision made by the Board of the Reserve Bank of Australia to lift the cash rate to prevent runaway inflation.
- Policy #2 Deregulation of the financial market which introduced a floating exchange rate.
- Policy #3 The tightening of lending limits on commercial banks and the requirement that all commercial banks hold an Exchange Settlement account with the Central Bank

