Team Salary Year Stadium Attendance League |($ mil) mil Home Rur BA Wins ERA Opened mondbacks National 143.32 176 0.235 82 3.72 1998 2.242695 wes Drioles National 130.6 175 0.257 90 3.75 2017 2.555781 American 127.63 188 0.239 47 5.18 1992 1.564192 Sox American 227.4 208 0.268 108 3.75 1912 2.895575 National 194.26 167 0.258 95 3.65 1914 3.181089 ite Sox American 71.84 182 0.241 62 4.84 1991 1.608817 Reds ndians ockies National 100.31 172 0.254 67 4.63 2003 1.629356 American 142.8 216 0.259 91 3.77 1994 1.926701 National 143.97 210 0.256 91 4.33 1995 3.01588
Team Salary Year Stadium Attendance League |($ mil) mil Home Rur BA Wins ERA Opened mondbacks National 143.32 176 0.235 82 3.72 1998 2.242695 wes Drioles National 130.6 175 0.257 90 3.75 2017 2.555781 American 127.63 188 0.239 47 5.18 1992 1.564192 Sox American 227.4 208 0.268 108 3.75 1912 2.895575 National 194.26 167 0.258 95 3.65 1914 3.181089 ite Sox American 71.84 182 0.241 62 4.84 1991 1.608817 Reds ndians ockies National 100.31 172 0.254 67 4.63 2003 1.629356 American 142.8 216 0.259 91 3.77 1994 1.926701 National 143.97 210 0.256 91 4.33 1995 3.01588

Glencoe Algebra 1, Student Edition, 9780079039897, 0079039898, 2018
18th Edition
ISBN:9780079039897
Author:Carter
Publisher:Carter
Chapter10: Statistics
Section10.6: Summarizing Categorical Data
Problem 30PPS

Related questions

Topic Video
Question
100%
i want to solve it in minitab please
Transcribed Image Text:A
В
E
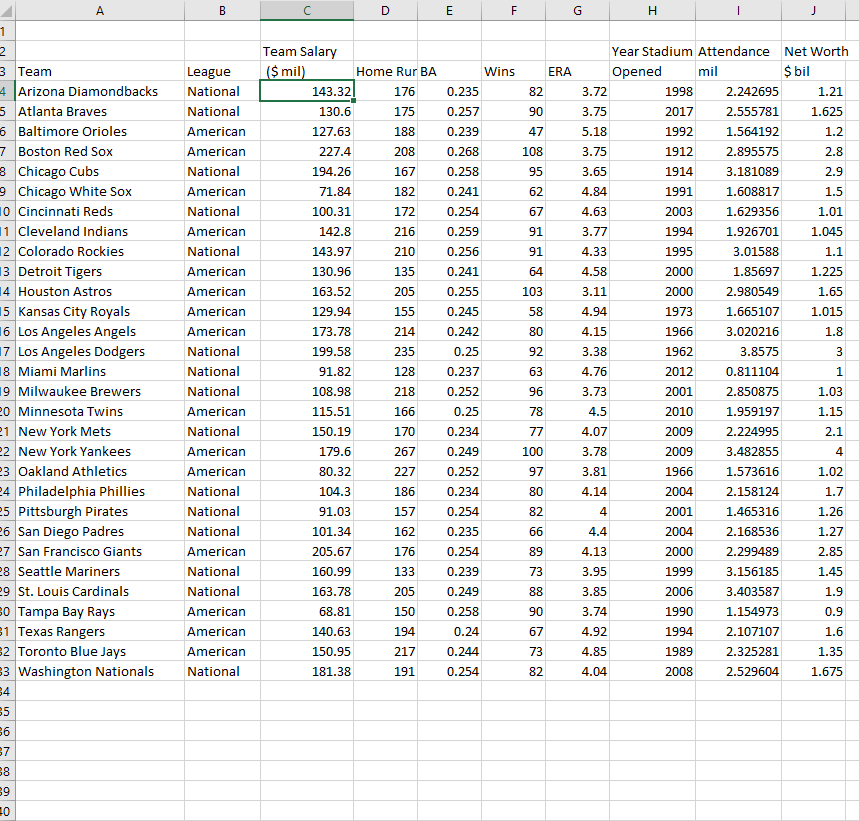
Team Salary
Year Stadium Attendance Net Worth
3 Тeam
League
($ mil)
Wins
Opened
mil
$ bil
Home Rur BA
ERA
4 Arizona Diamondbacks
5 Atlanta Braves
6 Baltimore Orioles
National
143.32
176
0.235
82
3.72
1998
2.242695
1.21
National
130.6
175
0.257
90
3.75
2017
2.555781
1.625
American
127.63
188
0.239
47
5.18
1992
1.564192
1.2
7 Boston Red Sox
American
227.4
208
0.268
108
3.75
1912
2.895575
2.8
8 Chicago Cubs
9 Chicago White Sox
10 Cincinnati Reds
11 Cleveland Indians
12 Colorado Rockies
13 Detroit Tigers
14 Houston Astros
15 Kansas City Royals
16 Los Angeles Angels
17 Los Angeles Dodgers
18 Miami Marlins
19 Milwaukee Brewers
National
194.26
167
0.258
95
3.65
1914
3.181089
2.9
American
71.84
182
0.241
62
4.84
1991
1.608817
1.5
National
100.31
172
0.254
67
4.63
2003
1.629356
1.01
American
142.8
216
0.259
91
3.77
1994
1.926701
1.045
National
143.97
210
0.256
91
4.33
1995
3.01588
1.1
American
130.96
135
0.241
64
4.58
2000
1.85697
1.225
American
163.52
205
0.255
103
3.11
2000
2.980549
1.65
American
129.94
155
0.245
58
4.94
1973
1.665107
1.015
American
173.78
214
0.242
80
4.15
1966
3.020216
1.8
National
199.58
235
0.25
92
3.38
1962
3.8575
National
91.82
128
0.237
63
4.76
2012
0.811104
1
National
108.98
218
0.252
96
3.73
2001
2.850875
1.03
20 Minnesota Twins
American
115.51
166
0.25
78
4.5
2010
1.959197
1.15
21 New York Mets
National
150.19
170
0.234
77
4.07
2009
2.224995
2.1
22 New York Yankees
23 Oakland Athletics
American
179.6
267
0.249
100
3.78
2009
3.482855
4
American
80.32
227
0.252
97
3.81
1966
1.573616
1.02
24 Philadelphia Phillies
National
104.3
186
0.234
80
4.14
2004
2.158124
1.7
25 Pittsburgh Pirates
26 San Diego Padres
National
91.03
157
0.254
82
4
2001
1.465316
1.26
National
101.34
162
0.235
66
4.4
2004
2.168536
1.27
27 San Francisco Giants
American
205.67
176
0.254
89
4.13
2000
2.299489
2.85
28 Seattle Mariners
29 St. Louis Cardinals
во Tampa Bay Rays
31 Texas Rangers
32 Toronto Blue Jays
33 Washington Nationals
National
160.99
133
0.239
73
3.95
1999
3.156185
1.45
National
163.78
205
0.249
88
3.85
2006
3.403587
1.9
American
68.81
150
0.258
90
3.74
1990
1.154973
0.9
American
140.63
194
0.24
67
4.92
1994
2.107107
1.6
American
150.95
217
0.244
73
4.85
1989
2.325281
1,35
National
181.38
191
0.254
82
4.04
2008
2.529604
1.675
34
35
36
37
38
39
30
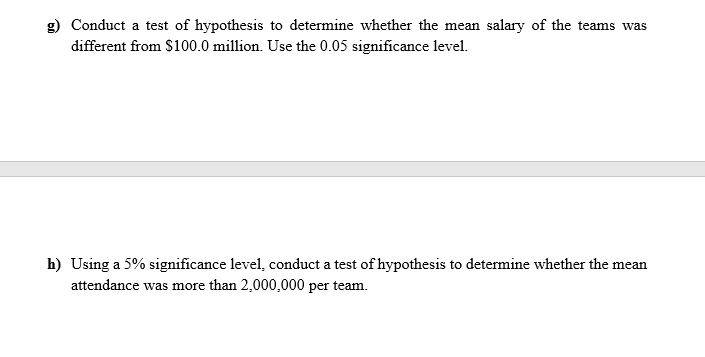
Transcribed Image Text:Conduct a test of hypothesis to determine whether the mean salary of the teams was
different from $100.0 million. Use the 0.05 significance level.
h) Using a 5% significance level, conduct a test of hypothesis to determine whether the mean
attendance was more than 2,000,000 per team.
Expert Solution
This question has been solved!
Explore an expertly crafted, step-by-step solution for a thorough understanding of key concepts.

This is a popular solution!

Trending now
This is a popular solution!

Step by step
Solved in 8 steps with 3 images

Knowledge Booster


Learn more about
Need a deep-dive on the concept behind this application? Look no further. Learn more about this topic, statistics and related others by exploring similar questions and additional content below.Recommended textbooks for you
Glencoe Algebra 1, Student Edition, 9780079039897…
Algebra
ISBN:
9780079039897
Author:
Carter
Publisher:
McGraw Hill

College Algebra (MindTap Course List)
Algebra
ISBN:
9781305652231
Author:
R. David Gustafson, Jeff Hughes
Publisher:
Cengage Learning
Glencoe Algebra 1, Student Edition, 9780079039897…
Algebra
ISBN:
9780079039897
Author:
Carter
Publisher:
McGraw Hill
College Algebra (MindTap Course List)
Algebra
ISBN:
9781305652231
Author:
R. David Gustafson, Jeff Hughes
Publisher:
Cengage Learning