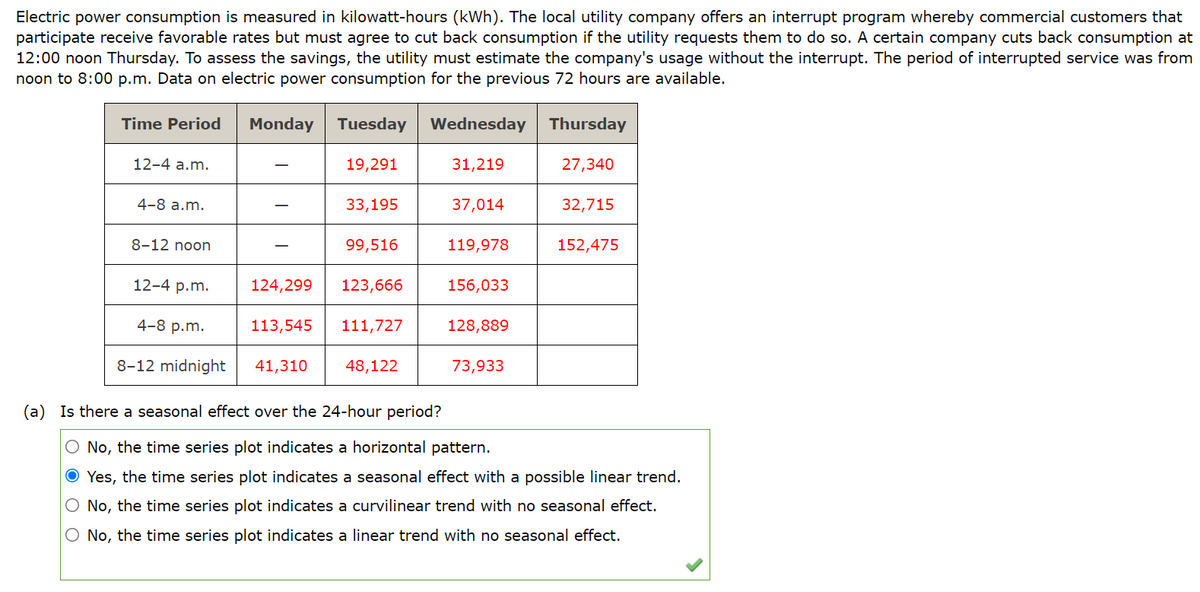
Time Period Monday Tuesday Wednesday Thursday 12-4 a.m. 19,291 31,219 27,340 4-8 a.m. 33,195 37,014 32,715 8-12 noon 99,516 119,978 152,475 12-4 p.m. 124,299 123,666 156,033 4-8 р.m. 113,545 111,727 128,889 8-12 midnight 41,310 48,122 73,933


Inverse Normal Distribution
The method used for finding the corresponding z-critical value in a normal distribution using the known probability is said to be an inverse normal distribution. The inverse normal distribution is a continuous probability distribution with a family of two parameters.
Mean, Median, Mode
It is a descriptive summary of a data set. It can be defined by using some of the measures. The central tendencies do not provide information regarding individual data from the dataset. However, they give a summary of the data set. The central tendency or measure of central tendency is a central or typical value for a probability distribution.
Z-Scores
A z-score is a unit of measurement used in statistics to describe the position of a raw score in terms of its distance from the mean, measured with reference to standard deviation from the mean. Z-scores are useful in statistics because they allow comparison between two scores that belong to different normal distributions.
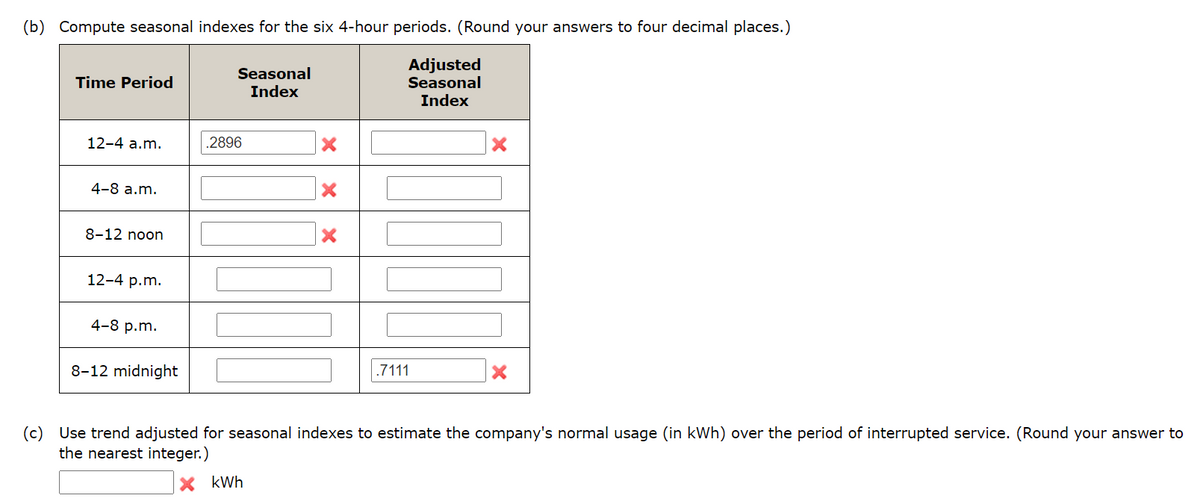
I can't figure this out. keep getting it wrong. Please help

Step by step
Solved in 2 steps


