Team sales personnel think that merchandise sales at their upcoming sporting event could be related to ticket sales. Below is the data from past home games for a regression analysis: Merchandise Sales ($10,000s) Tickets Sold (1000s) 15 54 17 67 10 53 9 49 16 59 14 58 12 56 19 63 18 65 17 61 What is the regression equation? Use the model to forecast merchandise sales if there are 58,000 tickets sold. Is the model statistically significant at the .05 level? How much of the variability in merchandise sales is determined by tickets sold?


Correlation
Correlation defines a relationship between two independent variables. It tells the degree to which variables move in relation to each other. When two sets of data are related to each other, there is a correlation between them.
Linear Correlation
A correlation is used to determine the relationships between numerical and categorical variables. In other words, it is an indicator of how things are connected to one another. The correlation analysis is the study of how variables are related.
Regression Analysis
Regression analysis is a statistical method in which it estimates the relationship between a dependent variable and one or more independent variable. In simple terms dependent variable is called as outcome variable and independent variable is called as predictors. Regression analysis is one of the methods to find the trends in data. The independent variable used in Regression analysis is named Predictor variable. It offers data of an associated dependent variable regarding a particular outcome.
- Team sales personnel think that merchandise sales at their upcoming sporting
event could be related to ticket sales. Below is the data from past home games for aregression analysis :
|
Merchandise Sales ($10,000s) |
Tickets Sold (1000s) |
|
15 |
54 |
|
17 |
67 |
|
10 |
53 |
|
9 |
49 |
|
16 |
59 |
|
14 |
58 |
|
12 |
56 |
|
19 |
63 |
|
18 |
65 |
|
17 |
61 |
- What is the regression equation?
- Use the model to forecast merchandise sales if there are 58,000 tickets sold.
- Is the model statistically significant at the .05 level?
- How much of the variability in merchandise sales is determined by tickets sold?
We can use the excel data analysis tool to find the answer to the given question. The steps are as follows:
- Type the data in excel.
- Click on Data tab and then click on Data Analysis.
- Choose the Regression and press ok
- Then Input Y range will have the "Merchandise Sales ($10,000s)" data
- Input X range will have the "Tickets Sold (1000s)" data
- Mark the Labels
- Choose the output range example cell D1
- Press Ok.
The excel output is:
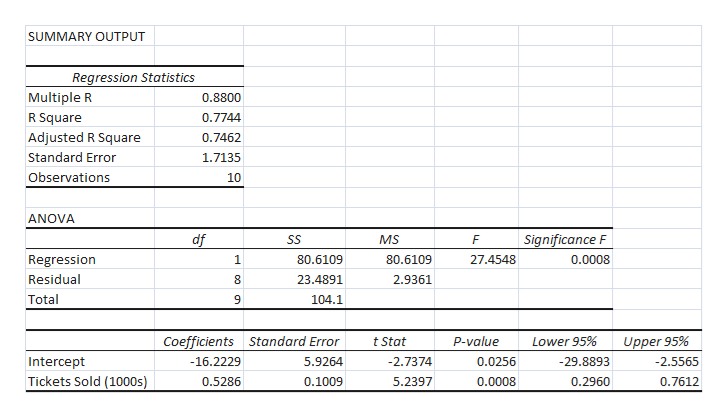
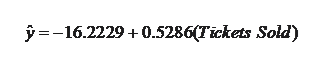
1. What is the regression equation?
Answer: From the given output, we have:
Intercept = -16.2229
Slope = 0.5286
Therefore, the regression equation is:
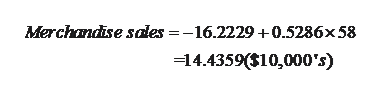
2. Use the model to forecast merchandise sales if there are 58,000 tickets sold.
Answer:

Step by step
Solved in 5 steps with 3 images


